\n
## Line Charts: NMSE vs. Time for Different Models
### Overview
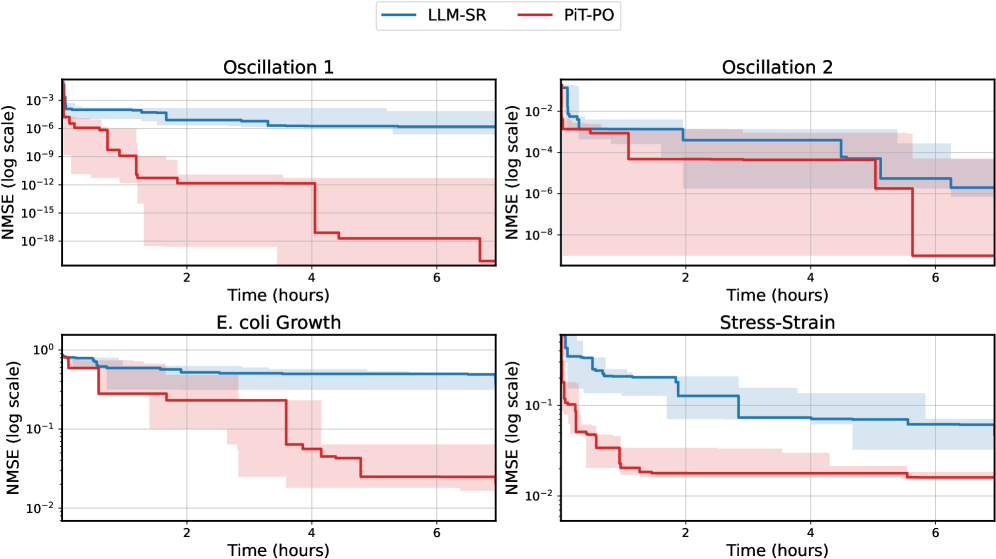
The image presents four line charts, each depicting the Normalized Mean Squared Error (NMSE) on a logarithmic scale against Time (in hours). Two models, LLM-SR (blue) and PIT-PO (red), are compared across four different conditions: Oscillation 1, Oscillation 2, E. coli Growth, and Stress-Strain. Each line represents the mean NMSE, and the shaded area around each line represents the standard deviation.
### Components/Axes
* **X-axis:** Time (hours), ranging from 0 to 6 hours.
* **Y-axis:** NMSE (log scale), ranging from 10<sup>-18</sup> to 10<sup>1</sup>.
* **Models:**
* LLM-SR (blue)
* PIT-PO (red)
* **Conditions (Chart Titles):**
* Oscillation 1
* Oscillation 2
* E. coli Growth
* Stress-Strain
### Detailed Analysis or Content Details
**Oscillation 1 (Top-Left):**
* **LLM-SR (Blue):** The line starts at approximately 8 x 10<sup>-4</sup> NMSE at time 0, decreases steadily to approximately 2 x 10<sup>-12</sup> NMSE at time 6 hours. The shaded area indicates a relatively small standard deviation.
* **PIT-PO (Red):** The line starts at approximately 1 x 10<sup>-3</sup> NMSE at time 0, decreases rapidly to approximately 5 x 10<sup>-15</sup> NMSE at time 4 hours, and then plateaus. The shaded area is wider than for LLM-SR, indicating a larger standard deviation.
**Oscillation 2 (Top-Right):**
* **LLM-SR (Blue):** The line starts at approximately 2 x 10<sup>-2</sup> NMSE at time 0, decreases steadily to approximately 1 x 10<sup>-6</sup> NMSE at time 6 hours. The shaded area is relatively narrow.
* **PIT-PO (Red):** The line starts at approximately 3 x 10<sup>-2</sup> NMSE at time 0, decreases to approximately 2 x 10<sup>-5</sup> NMSE at time 2 hours, then decreases more slowly to approximately 5 x 10<sup>-7</sup> NMSE at time 6 hours. The shaded area is wider than for LLM-SR.
**E. coli Growth (Bottom-Left):**
* **LLM-SR (Blue):** The line starts at approximately 0.8 NMSE at time 0, decreases to approximately 0.02 NMSE at time 6 hours. The shaded area is relatively narrow.
* **PIT-PO (Red):** The line starts at approximately 1 NMSE at time 0, decreases rapidly to approximately 0.1 NMSE at time 2 hours, then decreases more slowly to approximately 0.03 NMSE at time 6 hours. The shaded area is wider than for LLM-SR.
**Stress-Strain (Bottom-Right):**
* **LLM-SR (Blue):** The line starts at approximately 0.1 NMSE at time 0, decreases to approximately 0.01 NMSE at time 6 hours. The shaded area is relatively narrow.
* **PIT-PO (Red):** The line starts at approximately 0.2 NMSE at time 0, decreases to approximately 0.02 NMSE at time 6 hours. The shaded area is wider than for LLM-SR.
### Key Observations
* In all four conditions, LLM-SR generally exhibits a lower NMSE than PIT-PO, indicating better performance.
* The standard deviation around the LLM-SR lines is consistently smaller than that around the PIT-PO lines, suggesting more stable performance.
* The rate of NMSE decrease is generally faster for both models in the initial stages (0-2 hours) and then slows down.
* The PIT-PO model shows a more pronounced plateau in the Oscillation 1 chart.
### Interpretation
The data suggests that the LLM-SR model consistently outperforms the PIT-PO model across all four tested conditions. The lower NMSE values and smaller standard deviations indicate that LLM-SR provides more accurate and reliable predictions. The initial rapid decrease in NMSE for both models likely reflects the models quickly learning the underlying dynamics of each condition. The subsequent slower decrease and eventual plateau suggest that the models are approaching their limits of accuracy or that the dynamics become more complex over time. The wider standard deviation for PIT-PO suggests that its performance is more sensitive to variations in the data or initial conditions. The different conditions (Oscillations, E. coli growth, Stress-Strain) represent different types of dynamic systems, and the consistent outperformance of LLM-SR suggests that it is a more robust and versatile model for predicting these types of systems. The logarithmic scale on the Y-axis emphasizes the magnitude of the error reduction, particularly at lower NMSE values.