## Diagram: DPO vs. Step-DPO
### Overview
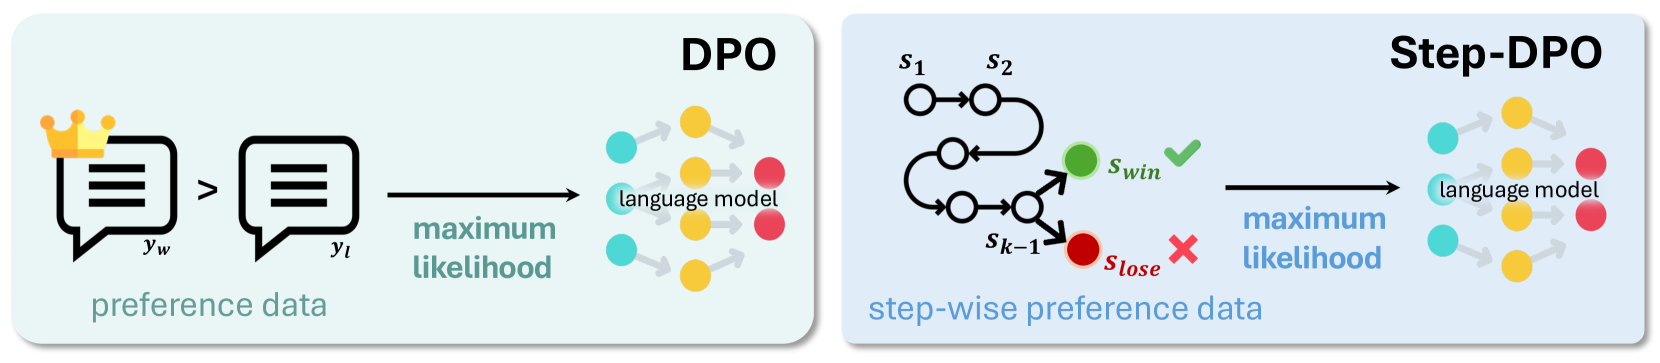
The image presents two diagrams illustrating the Direct Preference Optimization (DPO) and Step-wise Direct Preference Optimization (Step-DPO) methods. Both diagrams depict a process involving preference data, maximum likelihood estimation, and a language model. The Step-DPO diagram includes a state transition diagram with winning and losing states.
### Components/Axes
**Left Diagram (DPO):**
* **Title:** DPO (top-right)
* **Input:** Preference data, represented by two speech bubbles. The left bubble is labeled with a crown icon and "yw", and the right bubble is labeled "yl". An arrow points from the left bubble to the right bubble.
* **Process:** "maximum likelihood" (below the right speech bubble)
* **Output:** "language model" (right side), represented by a series of interconnected colored circles (cyan, yellow, red).
**Right Diagram (Step-DPO):**
* **Title:** Step-DPO (top-right)
* **Input:** Step-wise preference data, represented by a state transition diagram. States are labeled s1, s2, and sk-1. A green circle labeled "Swin" with a green checkmark indicates a winning state. A red circle labeled "Slose" with a red cross indicates a losing state.
* **Process:** "maximum likelihood" (below the state transition diagram)
* **Output:** "language model" (right side), represented by a series of interconnected colored circles (cyan, yellow, red).
### Detailed Analysis
**Left Diagram (DPO):**
* The preference data consists of two options, yw and yl, where yw is preferred over yl.
* The maximum likelihood step optimizes the language model based on this preference data.
* The language model is represented by a network of nodes, suggesting a transformation or processing step.
**Right Diagram (Step-DPO):**
* The step-wise preference data is represented as a state transition diagram.
* The diagram shows transitions between states s1, s2, and sk-1, eventually leading to either a winning state (Swin) or a losing state (Slose).
* The maximum likelihood step optimizes the language model based on the outcome of the state transitions.
* The language model is represented by a network of nodes, similar to the DPO diagram.
### Key Observations
* Both DPO and Step-DPO aim to optimize a language model based on preference data.
* DPO uses direct preference data, while Step-DPO uses step-wise preference data represented as a state transition diagram.
* The state transition diagram in Step-DPO introduces the concept of winning and losing states, which are used to guide the optimization process.
### Interpretation
The diagrams illustrate two different approaches to optimizing language models based on preference data. DPO directly uses pairwise preferences, while Step-DPO uses a step-wise approach that models the decision-making process as a series of state transitions. The Step-DPO method may be useful in scenarios where the preference data is not directly available but can be inferred from a sequence of actions or decisions. The use of winning and losing states in Step-DPO allows for a more nuanced optimization process that takes into account the sequential nature of the data.