# Technical Data Extraction: WS2 Simulation Heatmaps
This document provides a detailed technical extraction of the data presented in the two-panel scientific visualization. The image consists of two heatmaps, labeled (k) and (l), representing physical properties of a $WS_2$ (Tungsten Disulfide) system.
## 1. General Metadata and Global Parameters
Both panels share the following experimental/simulation parameters:
* **Material:** $WS_2$
* **Fermi Energy ($E_F$):** $-300 \text{ meV}$
* **Angle ($\theta$):** $15^\circ$
* **Y-Axis Label:** width (nm)
* **X-Axis Label:** length (nm)
* **Y-Axis Scale:** $-10$ to $10$ (with ticks at $-10, 0, 10$)
* **X-Axis Scale:** $-40$ to $40$ (with ticks at $-40, -20, 0, 20, 40$)
---
## 2. Panel (k) Analysis
### Header Information
* **Label:** (k)
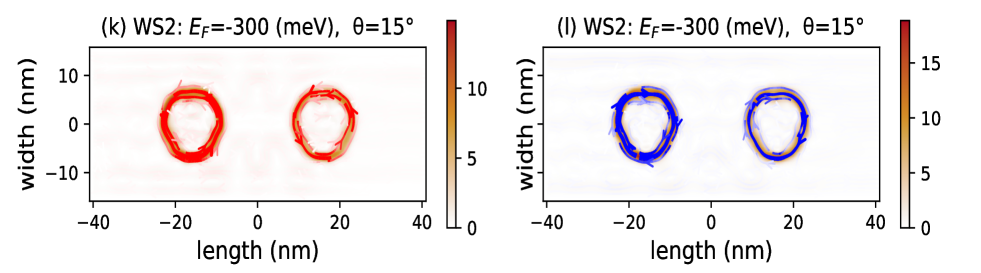
* **Title:** $WS_2: E_F = -300 \text{ (meV)}, \theta = 15^\circ$
### Component Isolation: Main Chart (k)
* **Visual Trend:** The heatmap shows two distinct ring-like structures centered at approximately $x = -15 \text{ nm}$ and $x = +15 \text{ nm}$ along the $y = 0$ axis.
* **Vector Overlay:** Red arrows are superimposed on the rings.
* **Directionality:** The arrows indicate a **clockwise** circulation pattern in both the left and right rings.
* **Intensity Distribution:** The highest intensity (darkest red/orange) is concentrated along the perimeter of the rings, forming a circular "track."
### Component Isolation: Legend/Color Bar (k)
* **Spatial Placement:** Right side of panel (k).
* **Scale:** Linear, from $0$ to $15$.
* **Ticks:** $0, 5, 10$. (The top of the bar extends toward $15$).
* **Color Gradient:** White (0) $\rightarrow$ Light Orange $\rightarrow$ Dark Red/Brown (15).
---
## 3. Panel (l) Analysis
### Header Information
* **Label:** (l)
* **Title:** $WS_2: E_F = -300 \text{ (meV)}, \theta = 15^\circ$
### Component Isolation: Main Chart (l)
* **Visual Trend:** Similar to panel (k), this chart features two ring-like structures at $x \approx \pm 15 \text{ nm}$.
* **Vector Overlay:** Blue arrows are superimposed on the rings.
* **Directionality:** The arrows indicate a **counter-clockwise** circulation pattern in both the left and right rings. This is the primary differentiator from panel (k).
* **Intensity Distribution:** The background heatmap (orange/red) appears identical in intensity and spatial distribution to panel (k), suggesting the underlying scalar field is the same, while the vector field (blue arrows) represents a different component or state (e.g., opposite spin or valley).
### Component Isolation: Legend/Color Bar (l)
* **Spatial Placement:** Right side of panel (l).
* **Scale:** Linear, from $0$ to $15$.
* **Ticks:** $0, 5, 10, 15$.
* **Color Gradient:** White (0) $\rightarrow$ Light Orange $\rightarrow$ Dark Red/Brown (15).
---
## 4. Comparative Summary
| Feature | Panel (k) | Panel (l) |
| :--- | :--- | :--- |
| **Ring Centers** | $\approx \pm 15 \text{ nm}$ | $\approx \pm 15 \text{ nm}$ |
| **Vector Color** | Red | Blue |
| **Circulation** | Clockwise | Counter-clockwise |
| **Max Intensity** | $\approx 12-14$ (on 0-15 scale) | $\approx 12-14$ (on 0-15 scale) |
| **Background** | White/Neutral | White/Neutral |
**Technical Conclusion:** The images depict localized electronic or magnetic states in a $WS_2$ nanostructure. The two panels likely represent time-reversal symmetric partners or different valley/spin polarizations, as evidenced by the identical spatial intensity of the rings but perfectly inverted circulation directions (clockwise red vs. counter-clockwise blue).