## Dual-Axis Line Chart: MLNN Training Dynamics
### Overview
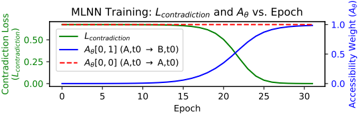
This image displays a dual-axis line chart titled "MLNN Training: $L_{contradiction}$ and $A_\theta$ vs. Epoch." It visualizes the relationship between a loss metric ($L_{contradiction}$) and two accessibility weights ($A_\theta$) over the course of 30 training epochs. The chart illustrates a transition phase where the model learns to minimize contradiction loss while increasing the accessibility weight for a specific state transition.
### Components/Axes
* **Title:** "MLNN Training: $L_{contradiction}$ and $A_\theta$ vs. Epoch" (Centered at the top).
* **X-Axis:** Labeled "Epoch," ranging from 0 to 30, with major tick marks at 0, 5, 10, 15, 20, 25, and 30.
* **Left Y-Axis (Green):** Labeled "Contradiction Loss ($L_{contradiction}$)," ranging from 0.00 to 0.50.
* **Right Y-Axis (Blue):** Labeled "Accessibility Weight ($A_\theta$)," ranging from 0.0 to 1.0.
* **Legend:** Located in the top-left quadrant of the chart area.
* **Solid Green Line:** $L_{contradiction}$
* **Solid Blue Line:** $A_\theta[0, 1] (A, t0 \rightarrow B, t0)$
* **Dashed Red Line:** $A_\theta[0, 0] (A, t0 \rightarrow A, t0)$
### Detailed Analysis
#### Trend Verification
* **Green Line ($L_{contradiction}$):** This line exhibits a high, stable plateau from epoch 0 to 15. It then undergoes a sharp, sigmoidal downward slope between epoch 15 and 25, converging to near-zero by epoch 25, where it remains flat until epoch 30.
* **Blue Line ($A_\theta[0, 1]$):** This line starts at 0.0 and remains flat until epoch 15. It then exhibits a sharp, sigmoidal upward slope between epoch 15 and 25, converging to approximately 1.0 by epoch 25, where it remains flat until epoch 30.
* **Red Dashed Line ($A_\theta[0, 0]$):** This line remains perfectly horizontal at a value of 1.0 across the entire duration (0 to 30 epochs).
#### Data Points (Approximate)
| Epoch | $L_{contradiction}$ (Green) | $A_\theta[0, 1]$ (Blue) | $A_\theta[0, 0]$ (Red) |
| :--- | :--- | :--- | :--- |
| 0 | ~0.75 (off-scale high) | 0.0 | 1.0 |
| 15 | ~0.70 | ~0.05 | 1.0 |
| 20 | ~0.45 | ~0.35 | 1.0 |
| 22.5 | ~0.20 | ~0.65 | 1.0 |
| 25 | ~0.05 | ~0.95 | 1.0 |
| 30 | ~0.0 | ~1.0 | 1.0 |
### Key Observations
* **Inverse Correlation:** There is a strong inverse correlation between the Contradiction Loss (Green) and the Accessibility Weight for the transition $A \rightarrow B$ (Blue). As the model learns to facilitate the transition, the contradiction loss drops.
* **Crossover Point:** The Green and Blue lines intersect at approximately epoch 22, at a value of roughly 0.45 on the normalized scale.
* **Phase Shift:** The training exhibits three distinct phases:
1. **Latency (0–15 epochs):** The model is not yet learning the transition; loss is high, and the transition weight is near zero.
2. **Learning/Transition (15–25 epochs):** Rapid optimization occurs.
3. **Convergence (25–30 epochs):** The model reaches a stable state where the transition is fully accessible and contradiction loss is minimized.
### Interpretation
This chart demonstrates the successful training of a Multi-Layer Neural Network (MLNN) to perform a specific state transition.
The data suggests the model is being trained to map state $A$ at time $t0$ to state $B$ at time $t0$ (represented by the Blue line). Simultaneously, the model maintains the identity mapping $A \rightarrow A$ (represented by the Red line), which is "hard-coded" or pre-established at a weight of 1.0.
The "Contradiction Loss" likely measures the penalty for the model failing to distinguish between these states or failing to execute the transition correctly. The sharp transition between epochs 15 and 25 indicates a "tipping point" in the learning process, likely where the gradient descent optimization overcomes the initial resistance or local minima, allowing the network to successfully learn the $A \rightarrow B$ mapping.