## Grid Diagram: Numbered Cell Matrix with Highlighted Cells
### Overview
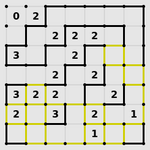
The image depicts a 6x8 grid of cells containing numerical values (0, 1, 2, 3) and empty spaces. Certain cells are highlighted in yellow, suggesting emphasis or significance. No explicit axis labels, legends, or textual annotations are present.
### Components/Axes
- **Grid Structure**:
- 6 rows (top to bottom) and 8 columns (left to right).
- Cells are uniformly sized with black borders.
- **Numerical Values**:
- Values include `0`, `1`, `2`, `3`, with most cells empty.
- Yellow highlights appear in 13 cells, distributed across the grid.
### Detailed Analysis
#### Grid Content
- **Row 0**: `[0, 2, _, _, _, _, _, _]`
- **Row 1**: `[_, _, 2, 2, 2, _, _, _]`
- **Row 2**: `[3, _, _, 2, _, _, _, _]`
- **Row 3**: `[_, _, 2, _, 2, _, _, _]`
- **Row 4**: `[3, 2, 2, _, _, 2, _, _]`
- **Row 5**: `[2, _, 3, _, _, 2, 1, _]`
#### Yellow Highlighted Cells
Positions (row, column):
- (0,1), (1,0), (1,7), (2,7), (3,0), (3,1), (3,2), (3,3), (4,0), (4,2), (4,5), (5,5), (5,6).
### Key Observations
1. **Numerical Distribution**:
- `2` is the most frequent value (12 instances), followed by `3` (4 instances), `0` (1 instance), and `1` (1 instance).
- Empty cells dominate (~50% of the grid).
2. **Highlighted Cells**:
- Yellow highlights cluster in the bottom-left quadrant (rows 3–5, columns 0–3) and sporadically in the top-right (e.g., (1,7), (2,7)).
- Highlighted cells contain values `2`, `3`, and `1`, but no `0`.
3. **Spatial Patterns**:
- The `3` values are concentrated in the first column (rows 2, 4) and row 5.
- The `1` is isolated in the bottom-right corner (row 5, column 6).
### Interpretation
- **Purpose Unclear**: The grid lacks contextual labels, making it ambiguous whether this represents a heatmap, puzzle (e.g., Sudoku variant), or abstract data visualization.
- **Highlighted Cells**: The yellow cells may indicate priority, selection, or thresholds (e.g., values ≥2). Their distribution suggests a focus on the lower-left and upper-right regions.
- **Numerical Anomalies**:
- The single `0` in the top-left corner stands out as a potential outlier.
- The `1` in the bottom-right is the only instance of its value, possibly signifying a unique or critical data point.
- **Potential Use Cases**:
- Could represent a sparse matrix for computational analysis, a game board, or a simplified heatmap where yellow highlights denote "active" or "significant" cells.
### Limitations
- No explicit legend or axis titles prevent definitive interpretation of numerical values.
- The absence of a clear pattern or legend leaves the grid’s purpose open to speculation.
This analysis assumes the grid is a data structure rather than a symbolic diagram, given the lack of explanatory elements. Further context would be required to validate hypotheses about its purpose.