\n
## Pie Charts: SFT Dataset and RL Dataset Distribution
### Overview
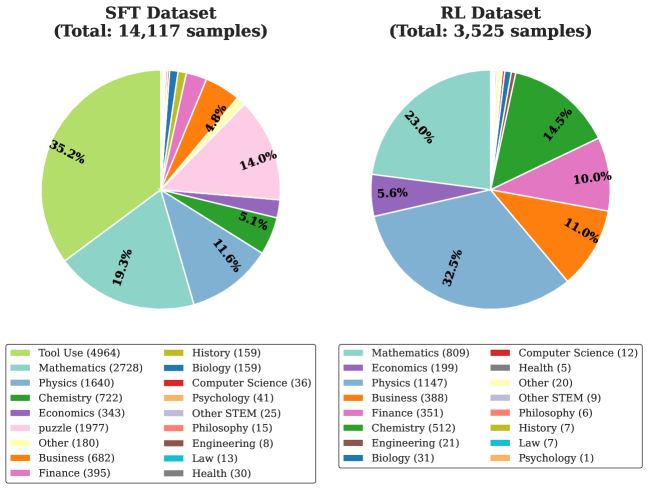
The image displays two pie charts side-by-side, each illustrating the distribution of categories within a different dataset. The left chart represents the "SFT Dataset" containing 14,117 total samples, and the right chart represents the "RL Dataset" containing 3,525 total samples. Each chart is accompanied by a detailed, two-column legend directly below it, listing all categories with their corresponding sample counts.
### Components/Axes
* **Chart Titles:**
* Left: "SFT Dataset (Total: 14,117 samples)"
* Right: "RL Dataset (Total: 3,525 samples)"
* **Chart Type:** Pie charts showing proportional distribution.
* **Legends:** Positioned directly below each respective chart. Each legend is a box containing two columns of entries. Each entry consists of a colored square swatch, a category name, and the sample count for that category in parentheses.
* **Data Representation:** Each slice of the pie corresponds to a category. The percentage of the total dataset is labeled on or near the larger slices. The color of each slice matches the swatch in its corresponding legend.
### Detailed Analysis
#### **SFT Dataset (Left Chart)**
* **Total Samples:** 14,117
* **Category Distribution (from largest to smallest slice, clockwise from top):**
1. **Tool Use:** Light green slice, 35.2% (4964 samples). Largest segment.
2. **Mathematics:** Teal slice, 19.3% (2728 samples).
3. **Physics:** Blue slice, 11.6% (1640 samples).
4. **Chemistry:** Dark green slice, 5.1% (722 samples).
5. **Economics:** Purple slice, 2.4% (343 samples).
6. **puzzle:** Pink slice, 14.0% (1977 samples). *Note: Category name is lowercase in the legend.*
7. **Other:** Light yellow slice, 1.3% (180 samples).
8. **Business:** Orange slice, 4.8% (682 samples).
9. **Finance:** Magenta slice, 2.8% (395 samples).
10. **History:** Olive green slice, 1.1% (159 samples).
11. **Biology:** Dark olive slice, 1.1% (159 samples).
12. **Computer Science:** Red slice, 0.3% (36 samples).
13. **Psychology:** Light orange slice, 0.3% (41 samples).
14. **Other STEM:** Light purple slice, 0.2% (25 samples).
15. **Philosophy:** Light pink slice, 0.1% (15 samples).
16. **Engineering:** Brown slice, 0.1% (8 samples).
17. **Law:** Cyan slice, 0.1% (13 samples).
18. **Health:** Grey slice, 0.2% (30 samples).
#### **RL Dataset (Right Chart)**
* **Total Samples:** 3,525
* **Category Distribution (from largest to smallest slice, clockwise from top):**
1. **Physics:** Blue slice, 32.3% (1147 samples). Largest segment.
2. **Mathematics:** Teal slice, 23.0% (809 samples).
3. **Economics:** Purple slice, 5.6% (199 samples).
4. **Business:** Orange slice, 11.0% (388 samples).
5. **Finance:** Magenta slice, 10.0% (351 samples).
6. **Chemistry:** Dark green slice, 14.5% (512 samples).
7. **Biology:** Dark olive slice, 0.9% (31 samples).
8. **Engineering:** Brown slice, 0.6% (21 samples).
9. **Computer Science:** Red slice, 0.3% (12 samples).
10. **Health:** Grey slice, 0.1% (5 samples).
11. **Other:** Light yellow slice, 0.6% (20 samples).
12. **Other STEM:** Light purple slice, 0.3% (9 samples).
13. **Philosophy:** Light pink slice, 0.2% (6 samples).
14. **History:** Olive green slice, 0.2% (7 samples).
15. **Law:** Cyan slice, 0.2% (7 samples).
16. **Psychology:** Light orange slice, 0.03% (1 sample).
* **Note:** The "Tool Use" and "puzzle" categories present in the SFT dataset are absent from the RL dataset legend and chart.
### Key Observations
1. **Dominant Categories:** Each dataset is dominated by one category: "Tool Use" (35.2%) in SFT and "Physics" (32.3%) in RL.
2. **Size Disparity:** The SFT dataset is approximately four times larger in total samples (14,117 vs. 3,525) than the RL dataset.
3. **Category Overlap & Shift:** While both datasets share many STEM and social science categories, their proportions differ significantly. "Mathematics" is the second-largest in both. "Physics" jumps from 3rd (11.6%) in SFT to 1st (32.3%) in RL. "Chemistry" increases from 5.1% to 14.5%.
4. **Unique Categories:** The SFT dataset contains two large, unique categories not found in the RL dataset: "Tool Use" (35.2%) and "puzzle" (14.0%). Their combined share (49.2%) constitutes nearly half of the SFT data.
5. **Long Tail:** Both datasets have a long tail of categories with very small percentages (often below 1%), indicating a wide variety of less-represented topics.
### Interpretation
The data suggests these datasets are curated for different phases or objectives in AI model training.
* **SFT Dataset (Supervised Fine-Tuning):** The massive representation of "Tool Use" and "puzzle" indicates a strong emphasis on training models to perform specific tasks, follow instructions, and solve structured problems. The broader distribution across many categories (including humanities like Philosophy and Law) suggests a goal of building generalist capabilities and diverse knowledge.
* **RL Dataset (Reinforcement Learning):** The shift towards heavy STEM subjects—Physics, Mathematics, and Chemistry now comprising ~70% of the data—implies a focus on training for reasoning, logical deduction, and problem-solving within well-defined, often quantitative domains. The near absence of "Tool Use" and "puzzle" suggests this phase is less about task execution and more about refining reasoning skills in core scientific disciplines.
The stark contrast in composition implies a pipeline: first, expose a model to a wide array of tasks and knowledge (SFT), then specialize and sharpen its reasoning abilities on challenging, structured academic subjects (RL). The RL dataset's smaller size is consistent with reinforcement learning often being applied to more focused, high-quality data after initial broad training.