## Chart: Answer Accuracy vs. Layer for Llama-3 Models
### Overview
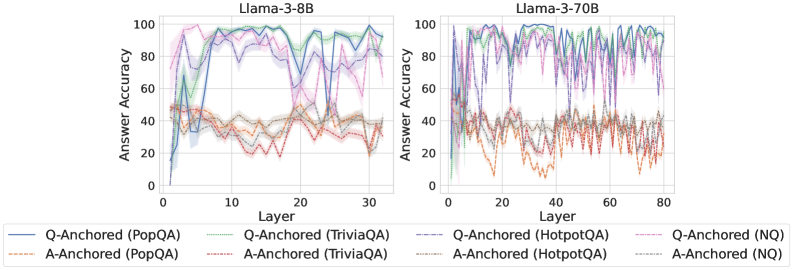
The image presents two line charts comparing the answer accuracy of Llama-3-8B and Llama-3-70B models across different layers. The x-axis represents the layer number, and the y-axis represents the answer accuracy. Each chart displays six data series, representing Q-Anchored and A-Anchored approaches for four different question answering datasets: PopQA, TriviaQA, HotpotQA, and NQ.
### Components/Axes
* **Titles:**
* Left Chart: Llama-3-8B
* Right Chart: Llama-3-70B
* **X-axis:**
* Label: Layer
* Left Chart: Scale from 0 to 30, with tick marks at intervals of 10.
* Right Chart: Scale from 0 to 80, with tick marks at intervals of 20.
* **Y-axis:**
* Label: Answer Accuracy
* Scale: 0 to 100, with tick marks at intervals of 20.
* **Legend:** Located at the bottom of the image, it identifies the data series by color and line style:
* Blue solid line: Q-Anchored (PopQA)
* Brown dashed line: A-Anchored (PopQA)
* Green dotted line: Q-Anchored (TriviaQA)
* Brown dotted-dashed line: A-Anchored (TriviaQA)
* Purple solid line: Q-Anchored (HotpotQA)
* Brown solid line: A-Anchored (HotpotQA)
* Pink dashed line: Q-Anchored (NQ)
* Grey dotted line: A-Anchored (NQ)
### Detailed Analysis
**Left Chart: Llama-3-8B**
* **Q-Anchored (PopQA) - Blue solid line:** Starts at approximately 10% accuracy, rapidly increases to around 60% by layer 5, and then rises to approximately 90% by layer 10. It fluctuates between 80% and 100% for the remaining layers.
* **A-Anchored (PopQA) - Brown dashed line:** Starts at approximately 40% accuracy and remains relatively stable between 30% and 50% across all layers.
* **Q-Anchored (TriviaQA) - Green dotted line:** Starts at approximately 50% accuracy, increases to around 80% by layer 10, and then fluctuates between 70% and 90% for the remaining layers.
* **A-Anchored (TriviaQA) - Brown dotted-dashed line:** Starts at approximately 40% accuracy and remains relatively stable between 30% and 50% across all layers.
* **Q-Anchored (HotpotQA) - Purple solid line:** Starts at approximately 50% accuracy, increases to around 90% by layer 10, and then fluctuates between 80% and 100% for the remaining layers.
* **A-Anchored (HotpotQA) - Brown solid line:** Starts at approximately 40% accuracy and remains relatively stable between 30% and 50% across all layers.
* **Q-Anchored (NQ) - Pink dashed line:** Starts at approximately 50% accuracy, increases to around 90% by layer 10, and then fluctuates between 80% and 100% for the remaining layers.
* **A-Anchored (NQ) - Grey dotted line:** Starts at approximately 40% accuracy and remains relatively stable between 30% and 50% across all layers.
**Right Chart: Llama-3-70B**
* **Q-Anchored (PopQA) - Blue solid line:** Starts at approximately 50% accuracy, increases to around 90% by layer 10, and then fluctuates between 80% and 100% for the remaining layers.
* **A-Anchored (PopQA) - Brown dashed line:** Starts at approximately 40% accuracy and remains relatively stable between 20% and 50% across all layers.
* **Q-Anchored (TriviaQA) - Green dotted line:** Starts at approximately 60% accuracy, increases to around 90% by layer 10, and then fluctuates between 80% and 100% for the remaining layers.
* **A-Anchored (TriviaQA) - Brown dotted-dashed line:** Starts at approximately 40% accuracy and remains relatively stable between 20% and 50% across all layers.
* **Q-Anchored (HotpotQA) - Purple solid line:** Starts at approximately 60% accuracy, increases to around 90% by layer 10, and then fluctuates between 80% and 100% for the remaining layers.
* **A-Anchored (HotpotQA) - Brown solid line:** Starts at approximately 40% accuracy and remains relatively stable between 20% and 50% across all layers.
* **Q-Anchored (NQ) - Pink dashed line:** Starts at approximately 60% accuracy, increases to around 90% by layer 10, and then fluctuates between 80% and 100% for the remaining layers.
* **A-Anchored (NQ) - Grey dotted line:** Starts at approximately 40% accuracy and remains relatively stable between 20% and 50% across all layers.
### Key Observations
* For both models, the Q-Anchored approach consistently outperforms the A-Anchored approach across all datasets.
* The Q-Anchored lines (blue, green, purple, pink) show a rapid increase in accuracy in the initial layers, followed by fluctuations at a high accuracy level.
* The A-Anchored lines (brown dashed, brown dotted-dashed, brown solid, grey dotted) remain relatively stable at a lower accuracy level throughout all layers.
* The Llama-3-70B model generally shows slightly higher initial accuracy for the Q-Anchored approaches compared to the Llama-3-8B model.
* The fluctuations in accuracy for the Q-Anchored approaches appear more pronounced in the Llama-3-70B model.
### Interpretation
The data suggests that anchoring the question (Q-Anchored) is a more effective strategy for improving answer accuracy in Llama-3 models compared to anchoring the answer (A-Anchored). The rapid increase in accuracy for the Q-Anchored approaches in the initial layers indicates that the model quickly learns to leverage the question information for better performance. The relatively stable and lower accuracy of the A-Anchored approaches suggests that anchoring the answer alone is not sufficient for achieving high accuracy.
The Llama-3-70B model, being larger, generally starts with a slightly higher accuracy for the Q-Anchored approaches, indicating that it has a better initial understanding of the question answering task. However, the more pronounced fluctuations in accuracy for the Llama-3-70B model could suggest that it is more sensitive to the specific characteristics of each layer or that it is exploring a wider range of potential solutions.