## Chart: Receiver Operating Characteristic (ROC) Curves
### Overview
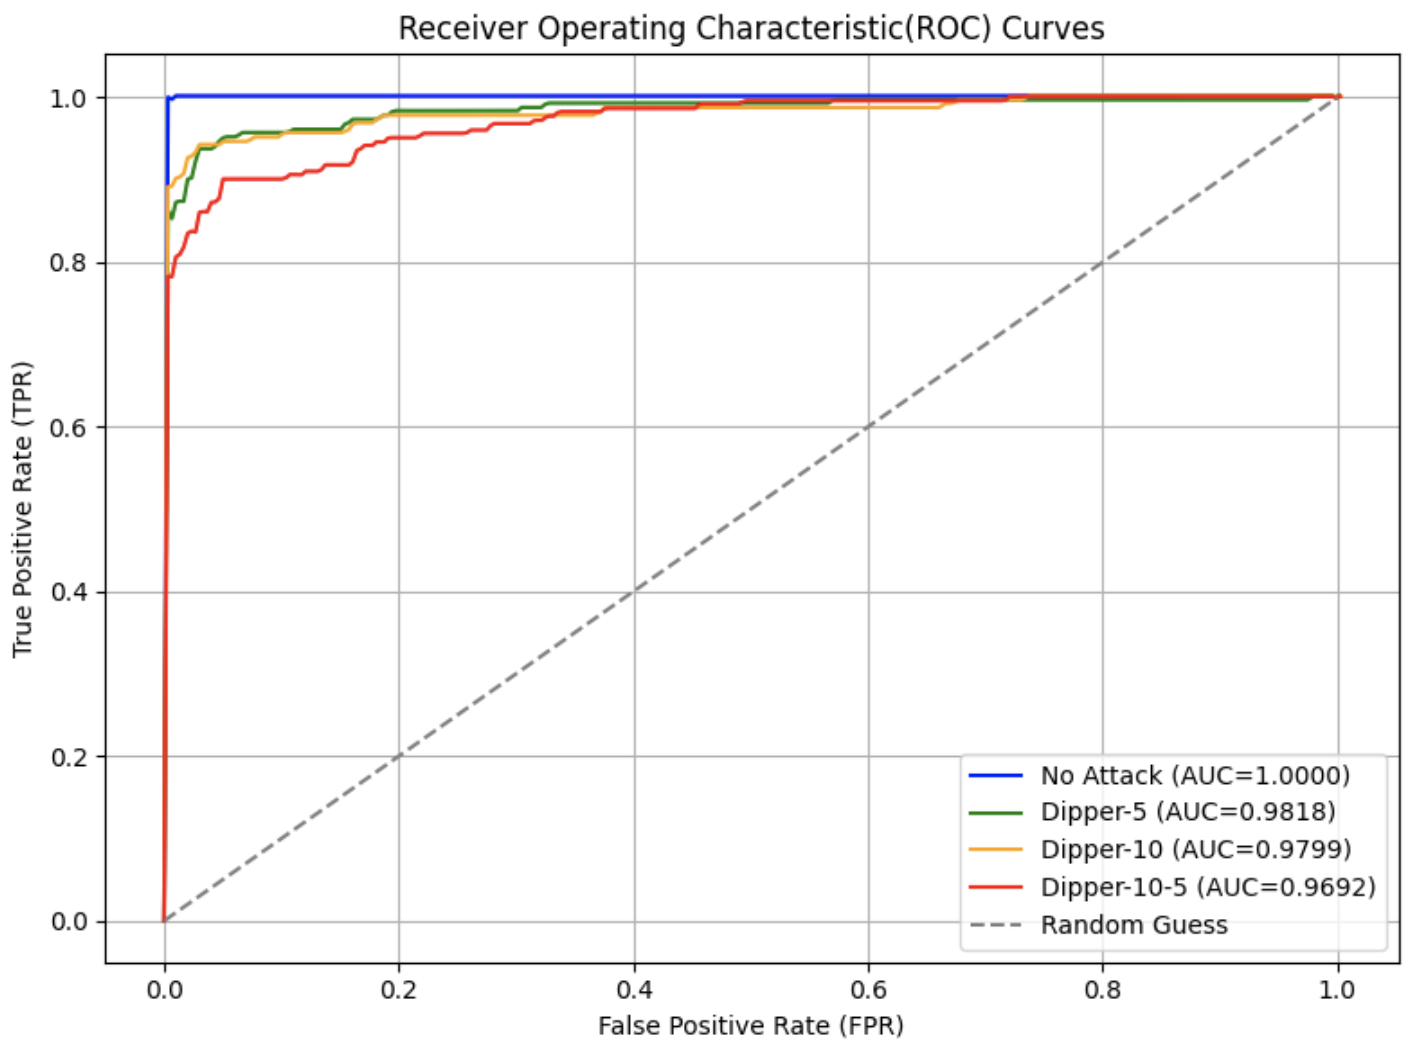
The image presents Receiver Operating Characteristic (ROC) curves for four different scenarios: "No Attack", "Dipper-5", "Dipper-10", and "Dipper-10-5", alongside a "Random Guess" baseline. The curves plot True Positive Rate (TPR) against False Positive Rate (FPR), providing a visual assessment of the performance of a binary classification model under varying threshold settings. The Area Under the Curve (AUC) is provided for each scenario.
### Components/Axes
* **Title:** Receiver Operating Characteristic(ROC) Curves
* **X-axis:** False Positive Rate (FPR) - Scale: 0.0 to 1.0
* **Y-axis:** True Positive Rate (TPR) - Scale: 0.0 to 1.0
* **Legend:** Located in the bottom-right corner.
* "No Attack" - Blue solid line (AUC = 1.0000)
* "Dipper-5" - Orange solid line (AUC = 0.9818)
* "Dipper-10" - Yellow solid line (AUC = 0.9799)
* "Dipper-10-5" - Green solid line (AUC = 0.9692)
* "Random Guess" - Gray dashed line
### Detailed Analysis
* **No Attack (Blue Line):** The curve starts at (0.0, 0.0) and quickly rises vertically to (approximately 0.0, 1.0) and remains at TPR = 1.0 for all FPR values. This indicates perfect classification performance with an AUC of 1.0000.
* **Dipper-5 (Orange Line):** The curve starts at (0.0, 0.0) and rises rapidly, reaching a TPR of approximately 0.8 at an FPR of 0.1. It continues to rise, approaching TPR = 1.0 as FPR approaches 1.0. The AUC is 0.9818.
* **Dipper-10 (Yellow Line):** The curve starts at (0.0, 0.0) and rises, but less steeply than the "Dipper-5" curve. It reaches a TPR of approximately 0.75 at an FPR of 0.1. The curve continues to rise, but remains below the "Dipper-5" curve. The AUC is 0.9799.
* **Dipper-10-5 (Green Line):** The curve starts at (0.0, 0.0) and rises, but is the least steep of the four scenarios. It reaches a TPR of approximately 0.7 at an FPR of 0.1. The curve remains below the "Dipper-5" and "Dipper-10" curves. The AUC is 0.9692.
* **Random Guess (Gray Dashed Line):** This line represents a diagonal from (0.0, 0.0) to (1.0, 1.0). It serves as a baseline for comparison; any curve above this line indicates performance better than random guessing.
### Key Observations
* The "No Attack" scenario exhibits perfect classification, as evidenced by the ROC curve reaching TPR = 1.0 almost immediately.
* The "Dipper-5" scenario demonstrates the best performance among the "Dipper" scenarios, with the highest AUC.
* As the "Dipper" scenarios become more complex ("Dipper-10" and "Dipper-10-5"), the AUC values decrease, indicating a reduction in classification performance.
* All four scenarios perform significantly better than random guessing, as their ROC curves lie above the diagonal "Random Guess" line.
### Interpretation
The ROC curves demonstrate the effectiveness of a classification model in distinguishing between positive and negative cases under different conditions. The "No Attack" scenario represents an ideal situation where the model can perfectly identify the absence of an attack. The "Dipper" scenarios likely represent different types or levels of attacks, with "Dipper-5" being the easiest to detect and "Dipper-10-5" being the most challenging. The decreasing AUC values as the "Dipper" scenarios become more complex suggest that the model's ability to accurately classify attacks diminishes with increasing complexity. The "Random Guess" line provides a crucial benchmark, highlighting that the model consistently outperforms chance. This data suggests that the model is effective at detecting attacks, but its performance is sensitive to the type and complexity of the attack. Further investigation could focus on improving the model's ability to classify the more complex "Dipper" scenarios.