## Line Chart: Accuracy vs. Ratio
### Overview
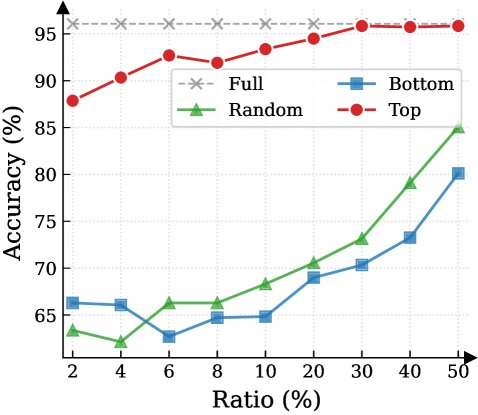
The image is a line chart comparing the accuracy of different methods ("Full", "Random", "Bottom", "Top") against varying ratios, ranging from 2% to 50%. The y-axis represents accuracy in percentage, and the x-axis represents the ratio in percentage.
### Components/Axes
* **X-axis:** Ratio (%), with markers at 2, 4, 6, 8, 10, 20, 30, 40, and 50.
* **Y-axis:** Accuracy (%), with markers at 65, 70, 75, 80, 85, 90, and 95.
* **Legend:** Located in the top-right of the chart.
* "Full" - Dashed gray line with 'x' markers.
* "Random" - Solid green line with triangle markers.
* "Bottom" - Solid blue line with square markers.
* "Top" - Solid red line with circle markers.
### Detailed Analysis
* **Full (Dashed Gray Line with 'x' markers):** This line remains almost constant at approximately 96% accuracy across all ratios.
* Ratio 2%: ~96%
* Ratio 50%: ~96%
* **Random (Solid Green Line with Triangle markers):** This line shows a general upward trend, indicating increasing accuracy with higher ratios.
* Ratio 2%: ~64%
* Ratio 6%: ~66%
* Ratio 20%: ~70%
* Ratio 50%: ~85%
* **Bottom (Solid Blue Line with Square markers):** This line also shows an upward trend, but with some fluctuations.
* Ratio 2%: ~66%
* Ratio 6%: ~63%
* Ratio 20%: ~70%
* Ratio 50%: ~80%
* **Top (Solid Red Line with Circle markers):** This line starts high and plateaus after a certain ratio.
* Ratio 2%: ~88%
* Ratio 6%: ~93%
* Ratio 20%: ~94%
* Ratio 50%: ~96%
### Key Observations
* The "Full" method consistently achieves the highest accuracy, remaining stable across all ratios.
* The "Top" method starts with high accuracy and quickly approaches the "Full" method's performance.
* The "Random" and "Bottom" methods show increasing accuracy as the ratio increases, but they remain significantly lower than the "Full" and "Top" methods.
* The "Bottom" method has a slight dip in accuracy between ratios 2% and 6%.
### Interpretation
The chart suggests that the "Full" method is the most reliable, maintaining high accuracy regardless of the ratio. The "Top" method is also effective, quickly reaching a high accuracy level. The "Random" and "Bottom" methods are less accurate, but their performance improves with higher ratios. This could indicate that as the ratio increases, the information captured by these methods becomes more relevant, leading to better accuracy. The "Bottom" method's initial dip might suggest that at very low ratios, it captures less useful information compared to the "Random" method.