## Tree Diagram with Bar Chart: Hierarchical Classification and Metric Analysis
### Overview
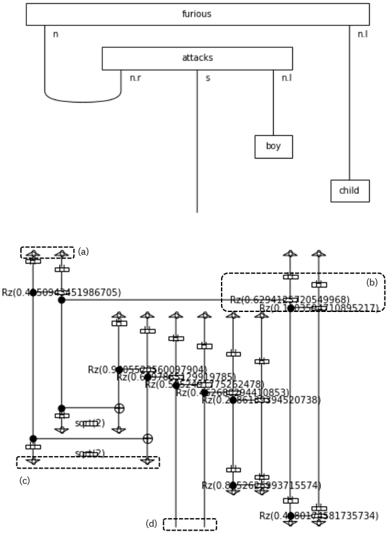
The image combines a hierarchical tree diagram at the top with a bar chart below. The tree diagram represents a classification structure, while the bar chart displays numerical metrics (Rz values) across four categories (a-d). Arrows indicate trends (upward/downward), and a legend distinguishes two data series ("squirt" and "squirt2").
### Components/Axes
#### Tree Diagram
- **Root**: "furious"
- **Branches**:
- Left: "n" → splits into "n.r" and "s"
- Right: "attacks" → splits into "boy" and "child"
- **Labels**: All text is in English.
#### Bar Chart
- **X-axis**: Categories labeled (a), (b), (c), (d)
- **Y-axis**: Rz values (e.g., Rz(0.45094451986705))
- **Legend**:
- "squirt": Solid line with square markers
- "squirt2": Dashed line with diamond markers
- **Arrows**: Vertical arrows indicate trend direction (↑ for increase, ↓ for decrease).
### Detailed Analysis
#### Tree Diagram
- **Structure**:
- "furious" (root) branches into "n" (left) and "attacks" (right).
- "n" splits into "n.r" (left) and "s" (right).
- "s" splits into "boy" (left) and "child" (right).
- "attacks" splits into "boy" (left) and "child" (right).
#### Bar Chart
- **Category (a)**:
- Two bars:
- Solid (squirt): Rz(0.45094451986705) ↑
- Dashed (squirt2): Rz(0.6294125320549968) ↑
- **Category (b)**:
- Three bars:
- Solid: Rz(0.9550560097904) ↑
- Dashed: Rz(0.52465175262478) ↑
- Solid: Rz(0.60097904) ↑
- **Category (c)**:
- Two bars:
- Solid: Rz(0.85265993715574) ↑
- Dashed: Rz(0.480125581735734) ↑
- **Category (d)**:
- Two bars:
- Solid: Rz(0.5265993715574) ↑
- Dashed: Rz(0.480125581735734) ↑
### Key Observations
1. **Tree Diagram**:
- "boy" and "child" appear as terminal nodes under both "n.r" and "attacks," suggesting overlapping classifications.
2. **Bar Chart**:
- **Trends**:
- Category (a): Both series increase, with "squirt2" higher than "squirt."
- Category (b): Mixed trends; "squirt" peaks at 0.955, while "squirt2" decreases.
- Categories (c) and (d): "squirt" consistently higher than "squirt2," with gradual declines.
- **Outliers**:
- Category (b) "squirt" value (0.955) is the highest across all categories.
- Category (b) "squirt2" value (0.5246) is the lowest among dashed lines.
### Interpretation
- **Tree Diagram**: Represents a hierarchical taxonomy where "furious" is the root, and "boy" and "child" are nested under multiple parent nodes, indicating potential redundancy or shared attributes.
- **Bar Chart**:
- The Rz metric varies significantly across categories.
- "squirt" (solid line) generally exhibits higher values than "squirt2" (dashed line), suggesting a performance or quality distinction between the two series.
- The upward arrows in most bars imply positive trends, though category (b) shows a decline for "squirt2."
- The overlapping "boy" and "child" nodes in the tree diagram may correlate with the Rz values in the bar chart, though no explicit link is provided.
### Critical Notes
- The image lacks explicit axis titles or units for Rz, limiting interpretability.
- The relationship between the tree diagram and bar chart is implied but not explicitly stated.
- The legend’s placement (bottom-right) is standard, but the absence of a colorbar or additional context complicates cross-referencing.