## Chart Type: Line Graphs Comparing Mistral-7B Model Versions
### Overview
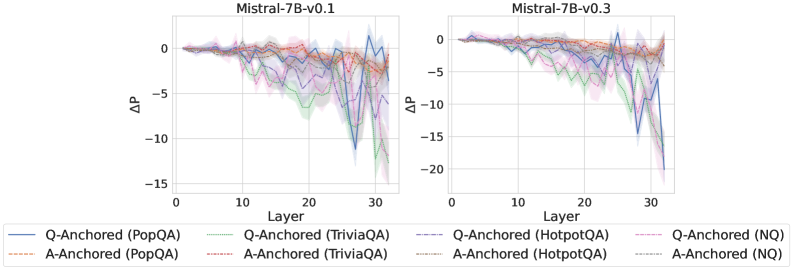
The image presents two line graphs side-by-side, comparing the performance of two versions of the Mistral-7B model (v0.1 and v0.3) across different layers. The y-axis represents ΔP (Delta P), and the x-axis represents the Layer number. Each graph displays six data series, representing different question-answering tasks, anchored by either "Q" (Question) or "A" (Answer). The shaded regions around each line represent the uncertainty or variance in the data.
### Components/Axes
* **Titles:**
* Left Graph: "Mistral-7B-v0.1"
* Right Graph: "Mistral-7B-v0.3"
* **X-axis:**
* Label: "Layer"
* Scale: 0 to 30, with tick marks at intervals of 10.
* **Y-axis:**
* Label: "ΔP"
* Scale (Left Graph): -15 to 0, with tick marks at intervals of 5.
* Scale (Right Graph): -20 to 0, with tick marks at intervals of 5.
* **Legend:** Located at the bottom of the image.
* Q-Anchored (PopQA): Solid Blue Line
* A-Anchored (PopQA): Dashed Brown Line
* Q-Anchored (TriviaQA): Dotted Green Line
* A-Anchored (TriviaQA): Dash-Dot Red Line
* Q-Anchored (HotpotQA): Dash-Dot Purple Line
* A-Anchored (HotpotQA): Dotted Gray Line
* Q-Anchored (NQ): Dash-Dot Pink Line
* A-Anchored (NQ): Dotted Gray Line
### Detailed Analysis
**Left Graph (Mistral-7B-v0.1):**
* **Q-Anchored (PopQA) - Solid Blue Line:** Initially around 0, it remains relatively stable until layer ~25, then sharply declines to approximately -12 at layer 30.
* **A-Anchored (PopQA) - Dashed Brown Line:** Starts near 0, gradually decreases to around -3 by layer 30.
* **Q-Anchored (TriviaQA) - Dotted Green Line:** Starts near 0, decreases to approximately -6 by layer 30.
* **A-Anchored (TriviaQA) - Dash-Dot Red Line:** Starts near 0, gradually decreases to around -3 by layer 30.
* **Q-Anchored (HotpotQA) - Dash-Dot Purple Line:** Starts near 0, decreases to approximately -5 by layer 30.
* **A-Anchored (HotpotQA) - Dotted Gray Line:** Starts near 0, gradually decreases to around -3 by layer 30.
* **Q-Anchored (NQ) - Dash-Dot Pink Line:** Starts near 0, decreases to approximately -4 by layer 30.
* **A-Anchored (NQ) - Dotted Gray Line:** Starts near 0, gradually decreases to around -3 by layer 30.
**Right Graph (Mistral-7B-v0.3):**
* **Q-Anchored (PopQA) - Solid Blue Line:** Initially around 0, it remains relatively stable until layer ~25, then sharply declines to approximately -18 at layer 30.
* **A-Anchored (PopQA) - Dashed Brown Line:** Starts near 0, gradually decreases to around -2 by layer 30.
* **Q-Anchored (TriviaQA) - Dotted Green Line:** Starts near 0, decreases to approximately -8 by layer 30.
* **A-Anchored (TriviaQA) - Dash-Dot Red Line:** Starts near 0, gradually decreases to around -2 by layer 30.
* **Q-Anchored (HotpotQA) - Dash-Dot Purple Line:** Starts near 0, decreases to approximately -4 by layer 30.
* **A-Anchored (HotpotQA) - Dotted Gray Line:** Starts near 0, gradually decreases to around -2 by layer 30.
* **Q-Anchored (NQ) - Dash-Dot Pink Line:** Starts near 0, decreases to approximately -3 by layer 30.
* **A-Anchored (NQ) - Dotted Gray Line:** Starts near 0, gradually decreases to around -2 by layer 30.
### Key Observations
* In both graphs, the "Q-Anchored (PopQA)" series (solid blue line) exhibits the most significant drop in ΔP towards the higher layers.
* The "A-Anchored" series generally show a more gradual and less pronounced decrease in ΔP compared to their "Q-Anchored" counterparts.
* The shaded regions indicate the variability in the data, with some series showing wider bands than others, suggesting greater uncertainty.
* The Mistral-7B-v0.3 model shows a more pronounced drop in ΔP for the "Q-Anchored (PopQA)" series compared to the v0.1 model.
### Interpretation
The graphs suggest that as the layer number increases, the performance (as measured by ΔP) of the Mistral-7B model tends to decrease, particularly for question-anchored tasks on the PopQA dataset. This could indicate that deeper layers in the model are less effective at processing or retaining information relevant to these specific tasks. The difference between the v0.1 and v0.3 models, especially in the "Q-Anchored (PopQA)" series, suggests that changes in the model architecture or training data may have exacerbated this performance degradation in the later layers. The smaller decrease in ΔP for answer-anchored tasks could imply that the model is more robust or efficient at processing information when the answer is the primary focus. The variability indicated by the shaded regions highlights the need for further investigation to understand the consistency and reliability of these performance trends.