## Line Chart: Model Performance Across Four Benchmarks
### Overview
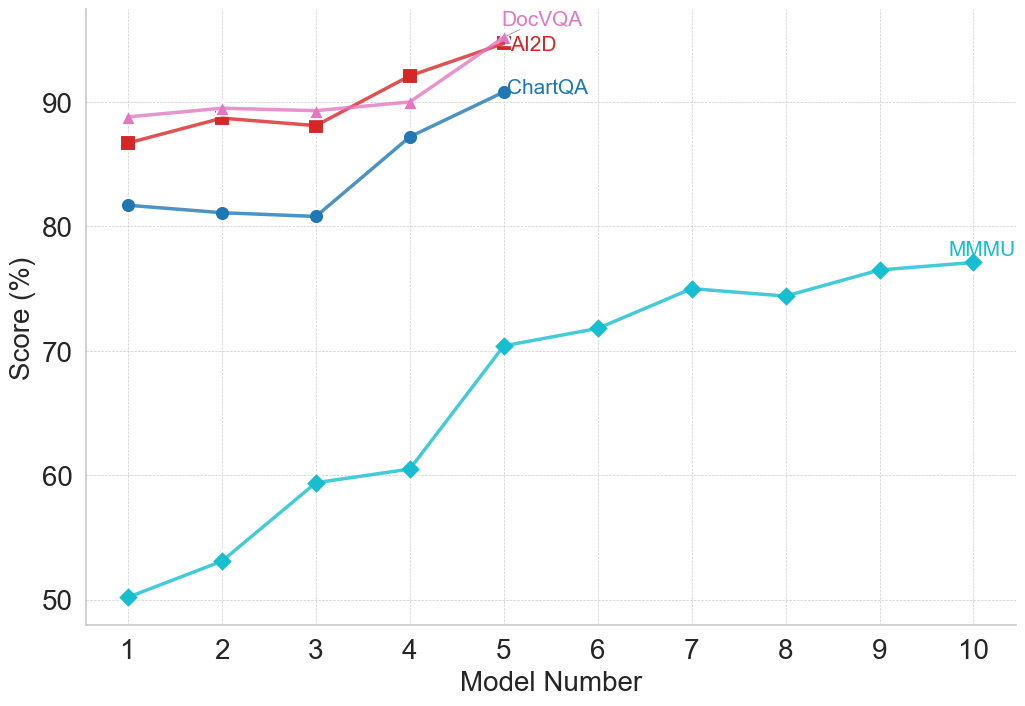
The image is a line chart comparing the performance scores (in percentage) of ten different models (labeled 1 through 10) across four distinct benchmarks: DocVQA, AI2D, ChartQA, and MMMU. The chart illustrates how scores change as the model number increases.
### Components/Axes
* **Chart Type:** Multi-series line chart with markers.
* **X-Axis:** Labeled "Model Number". It has discrete integer markers from 1 to 10.
* **Y-Axis:** Labeled "Score (%)". It has major gridlines and labels at 50, 60, 70, 80, and 90.
* **Legend:** Positioned in the top-right quadrant of the chart area. It contains four entries:
* **DocVQA:** Pink line with upward-pointing triangle markers.
* **AI2D:** Red line with square markers.
* **ChartQA:** Blue line with circle markers.
* **MMMU:** Cyan (light blue) line with diamond markers.
* **Grid:** A light gray, dashed grid is present for both horizontal and vertical axes.
### Detailed Analysis
**Data Series and Approximate Values:**
1. **MMMU (Cyan line, diamond markers):**
* **Trend:** Shows a strong, consistent upward trend across all ten models, with a slight plateau between models 7 and 8.
* **Data Points (Approximate):**
* Model 1: 50%
* Model 2: 53%
* Model 3: 59%
* Model 4: 60%
* Model 5: 70%
* Model 6: 72%
* Model 7: 75%
* Model 8: 74%
* Model 9: 76%
* Model 10: 77%
2. **ChartQA (Blue line, circle markers):**
* **Trend:** Starts with a slight dip, then increases sharply. Data is only plotted for models 1 through 5.
* **Data Points (Approximate):**
* Model 1: 82%
* Model 2: 81%
* Model 3: 81%
* Model 4: 87%
* Model 5: 91%
3. **AI2D (Red line, square markers):**
* **Trend:** Generally upward with a minor dip at model 3. Data is only plotted for models 1 through 5.
* **Data Points (Approximate):**
* Model 1: 87%
* Model 2: 89%
* Model 3: 88%
* Model 4: 92%
* Model 5: 95%
4. **DocVQA (Pink line, triangle markers):**
* **Trend:** Shows a steady, slight upward trend. Data is only plotted for models 1 through 5.
* **Data Points (Approximate):**
* Model 1: 89%
* Model 2: 90%
* Model 3: 90%
* Model 4: 90%
* Model 5: 95%
### Key Observations
1. **Performance Hierarchy:** For the first five models, DocVQA and AI2D consistently achieve the highest scores, followed by ChartQA, with MMMU scoring significantly lower.
2. **Convergence at Model 5:** At Model 5, the scores for DocVQA and AI2D converge at approximately 95%, the highest point on the chart. ChartQA also peaks here at ~91%.
3. **MMMU's Unique Trajectory:** The MMMU benchmark is the only one plotted for all ten models. It shows the most dramatic relative improvement, starting at 50% and ending at 77%, a 27-percentage-point gain.
4. **Data Completeness:** The ChartQA, AI2D, and DocVQA series are incomplete, providing data only for models 1-5. This prevents comparison with MMMU for models 6-10.
5. **Plateau in MMMU:** The MMMU score shows a near-plateau between Model 7 (75%) and Model 8 (74%), before resuming a slight upward trend.
### Interpretation
This chart likely visualizes the progression of capability across a series of increasingly advanced or larger AI models (represented by "Model Number") on specific multimodal understanding tasks.
* **Benchmark Difficulty:** The consistently lower scores for MMMU suggest it is a more challenging benchmark for these models compared to DocVQA, AI2D, and ChartQA, which may test more specialized or constrained skills.
* **Model Improvement:** The general upward trend for all benchmarks indicates that successive models (higher model numbers) demonstrate improved performance. The steep rise in MMMU scores suggests particular advancements in the capabilities it measures.
* **Specialization vs. Generalization:** The high, converging scores of DocVQA and AI2D at Model 5 might indicate that models have reached a performance ceiling on these specific tasks, or that the models are highly optimized for them. The continued, steady rise of MMMU suggests ongoing progress in a broader or more complex domain of understanding.
* **Missing Data:** The absence of data for ChartQA, AI2D, and DocVQA beyond Model 5 is a significant limitation. It is unclear if these benchmarks were not evaluated, if the models failed, or if the data was simply not included in this visualization. This prevents a full comparison of model evolution across all tasks for the complete set of ten models.