TECHNICAL ASSET FINGERPRINT
814efb72f92be6f7b7750153
Click to view fullscreen
Press ESC or click to close
FOUND IN PAPERS
EXPERT: healer-alpha-free VERSION 1
RUNTIME: free/openrouter/healer-alpha
INTEL_VERIFIED
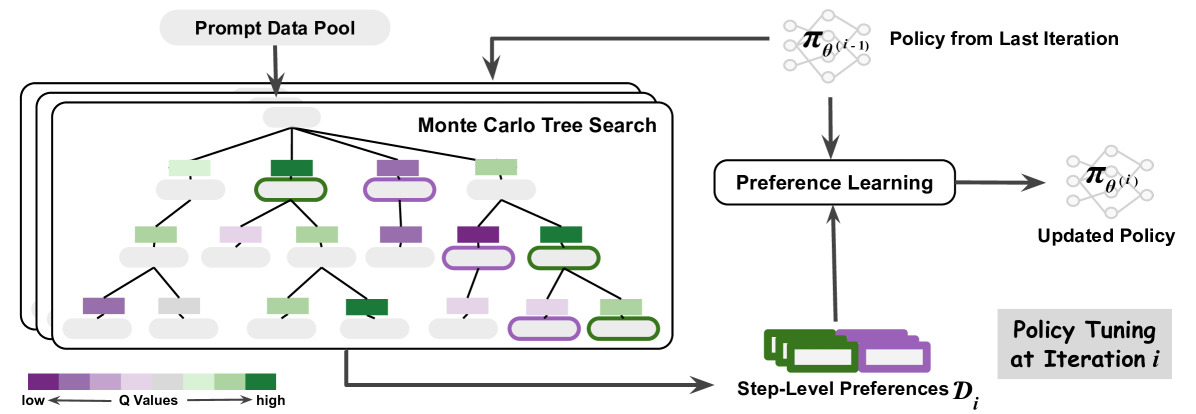
## Diagram: Iterative Policy Tuning via Monte Carlo Tree Search and Preference Learning
### Overview
The image is a technical flowchart illustrating an iterative machine learning process for policy optimization. The system uses a Monte Carlo Tree Search (MCTS) to explore a prompt data pool, generates step-level preferences from the search results, and uses these preferences to update a policy model. The process is cyclical, with the updated policy from one iteration becoming the input for the next.
### Components/Axes
The diagram is divided into two main sections: a left panel detailing the search process and a right panel showing the policy update loop.
**Left Panel - Search Process:**
* **Prompt Data Pool:** A rounded rectangle at the top-left, labeled "Prompt Data Pool". An arrow points downward from it into the main search box.
* **Monte Carlo Tree Search Box:** A large, rounded rectangle containing a tree structure. It is labeled "Monte Carlo Tree Search" in the top-right corner of the box.
* **Tree Structure:** A hierarchical tree with a root node at the top and multiple levels of child nodes. Nodes are represented by rounded rectangles.
* **Node Color Legend:** Located at the bottom-left of the image. It is a horizontal gradient bar labeled "Q Values". The left end is dark purple, labeled "low". The right end is dark green, labeled "high". The gradient transitions through shades of purple, light purple, light green, to green.
* **Output Arrow:** An arrow exits the bottom-right of the MCTS box, pointing to the right towards the "Step-Level Preferences" element.
**Right Panel - Policy Update Loop:**
* **Policy from Last Iteration:** Located at the top-right. It is represented by a network graph icon (nodes and edges) and labeled "Policy from Last Iteration". The mathematical notation `π_θ(i-1)` is written above the icon. An arrow points downward from this element.
* **Preference Learning:** A rounded rectangle in the center-right, labeled "Preference Learning". It receives two inputs: one from "Policy from Last Iteration" (from above) and one from "Step-Level Preferences" (from below).
* **Updated Policy:** To the right of "Preference Learning". It is represented by an identical network graph icon and labeled "Updated Policy". The notation `π_θ(i)` is written above it. An arrow points from "Preference Learning" to this element.
* **Step-Level Preferences:** Located at the bottom-center. It is represented by a stack of three colored rectangles (two green, one purple) and labeled "Step-Level Preferences `D_i`". An arrow points upward from this element to "Preference Learning".
* **Iteration Label:** A gray box in the bottom-right corner, labeled "Policy Tuning at Iteration `i`".
### Detailed Analysis
**1. Monte Carlo Tree Search (MCTS) Component:**
* The tree originates from a single root node (light gray).
* The root has four direct child nodes. From left to right, their approximate colors (based on the Q-Value legend) are: light green, dark green, purple, light green.
* The tree expands to a maximum of four levels deep (root, level 1, level 2, level 3).
* **Node Color Distribution:** The nodes exhibit a range of colors from the Q-Value spectrum.
* **High Q-Value (Green) Nodes:** Several nodes are dark or medium green, indicating high estimated value. Notable examples include a level-1 node (second from left) and a level-3 node (far right).
* **Low Q-Value (Purple) Nodes:** Several nodes are dark or medium purple, indicating low estimated value. Notable examples include a level-1 node (third from left) and a level-2 node (far left).
* **Medium Q-Value Nodes:** Many nodes are light green or light purple, representing intermediate values.
* **Spatial Grounding:** The legend is positioned at the bottom-left, clearly mapping the color gradient to the Q-Value scale from low (purple) to high (green).
**2. Policy Update Loop:**
* The flow is cyclical and iterative, as indicated by the notation `i` and `i-1`.
* The process at iteration `i` takes the policy from the previous iteration (`π_θ(i-1)`) and the newly generated preferences (`D_i`) as inputs to the "Preference Learning" module.
* The output is an updated policy for the current iteration (`π_θ(i)`).
* The "Step-Level Preferences `D_i`" are generated from the results of the Monte Carlo Tree Search, as shown by the connecting arrow.
### Key Observations
1. **Color-Coded Value Assessment:** The MCTS visualization uses a continuous color gradient (purple to green) to represent the estimated quality (Q-Value) of different search paths or states, allowing for a quick visual assessment of promising vs. poor branches.
2. **Hierarchical Exploration:** The tree structure shows a systematic exploration of possibilities from a prompt, branching out into multiple potential sequences of steps or decisions.
3. **Closed-Loop Learning:** The system forms a feedback loop where the policy's performance (evaluated via MCTS and preference learning) is used to directly improve the policy itself for the next cycle.
4. **Data Flow:** The diagram clearly traces the flow of information: from a static data pool, through an active search process, to the generation of preference data, and finally into a learning module that updates the core policy model.
### Interpretation
This diagram depicts a sophisticated reinforcement learning or AI alignment technique. The core idea is to use a planning algorithm (Monte Carlo Tree Search) to explore a vast space of possible actions or responses stemming from a given prompt. The search doesn't just find a single best answer; it generates a rich set of trajectories with associated value estimates (the Q-values shown by color).
These search results are distilled into "Step-Level Preferences" (`D_i`). This likely means the system compares different paths found by the MCTS and creates data that says, "Given this state, path A is preferred over path B." This preference data is more stable and informative for learning than simple reward signals.
The "Preference Learning" module then uses this curated data to adjust the parameters (`θ`) of the policy model (`π`), moving it towards behaviors that are preferred according to the search-based evaluation. By iterating this process (`i-1` to `i`), the policy progressively improves, becoming better at generating high-value responses that are consistent with the preferences extracted from its own simulated search.
The system essentially uses look-ahead planning (MCTS) to create its own training signal (preferences), enabling iterative self-improvement without requiring an external reward model for every step. This is a powerful paradigm for complex decision-making or generation tasks where direct supervision is scarce.
DECODING INTELLIGENCE...