## Flowchart: Monte Carlo Tree Search Process
### Overview
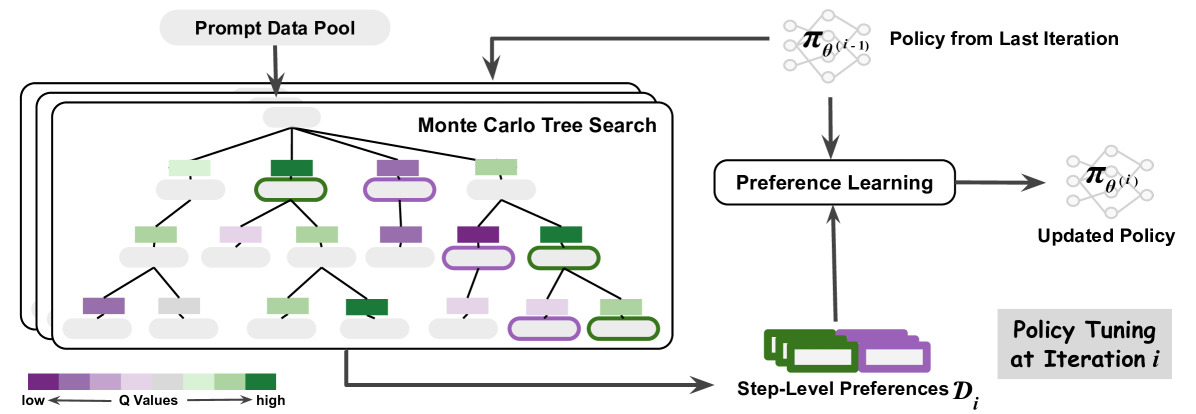
The diagram illustrates an iterative policy optimization process using Monte Carlo Tree Search (MCTS). It shows the flow from a prompt data pool through tree search, preference learning, and policy tuning. Color-coded nodes represent Q-values, with arrows indicating data flow and process dependencies.
### Components/Axes
1. **Legend** (bottom-left):
- Color gradient: Purple (low Q-values) → Green (high Q-values)
- Labels: "low" (purple) and "high" (green)
2. **Main Chart**:
- **Prompt Data Pool** (top-left):
- Rectangular container with downward arrow
- Feeds into MCTS
- **Monte Carlo Tree Search** (central):
- Tree structure with 3 levels of nodes
- Nodes colored by Q-values (purple to green)
- Arrows connect parent-child nodes
- **Preference Learning** (right-center):
- Oval container with bidirectional arrows
- Receives input from MCTS and previous policy
- Outputs updated policy
- **Policy Tuning** (bottom-right):
- Labeled "Policy Tuning at Iteration i"
- Contains green/purple rectangles labeled "Step-Level Preferences D_i"
3. **Policy Flow**:
- **Policy from Last Iteration** (top-right):
- Labeled π_θ(i-1)
- Feeds into Preference Learning
- **Updated Policy** (right-center):
- Labeled π_θ(i)
- Output of Preference Learning
### Detailed Analysis
- **Tree Structure**:
- Root node (top) connects to 3 child nodes (level 1)
- Level 1 nodes connect to 3-4 child nodes (level 2)
- Level 2 nodes connect to 2-3 child nodes (level 3)
- Color distribution:
- Level 1: 1 green, 1 purple, 1 gray
- Level 2: 2 green, 2 purple, 1 gray
- Level 3: 3 green, 2 purple, 1 gray
- **Arrows**:
- Solid arrows: Data flow from prompt pool → MCTS → Preference Learning
- Dashed arrows: Feedback loop from previous policy to Preference Learning
- Dotted arrows: Connection between Preference Learning and Policy Tuning
- **Policy Tuning**:
- Contains 3 green rectangles (high Q-values) and 2 purple rectangles (low Q-values)
- Labeled "Step-Level Preferences D_i" in bottom-right corner
### Key Observations
1. **Q-Value Distribution**:
- Higher Q-values (green) concentrate in deeper tree levels
- Root node has mixed Q-values (1 green, 1 purple, 1 gray)
2. **Process Flow**:
- Information flows downward through the tree
- Feedback loops exist between iterations via policy updates
3. **Color Consistency**:
- All green nodes match legend's "high" Q-value designation
- Purple nodes consistently represent "low" Q-values
### Interpretation
This diagram demonstrates an iterative policy optimization framework where:
1. **Exploration** occurs through MCTS, with nodes colored by Q-values indicating state-value estimates
2. **Exploitation** happens via policy updates informed by both tree search results and historical policy performance
3. The color gradient visualization helps identify promising nodes for expansion
4. The feedback loop between iterations suggests a reinforcement learning approach
5. The "Step-Level Preferences" in policy tuning likely represent contextual adjustments based on recent experiences
The process appears designed to balance exploration (via Q-value-guided tree search) and exploitation (via policy updates), with the color-coded visualization serving as a real-time diagnostic tool for identifying high-value decision paths.