## Line Chart and Scatter Plot: SFT on Qwen2.5-14B-Instruct
### Overview
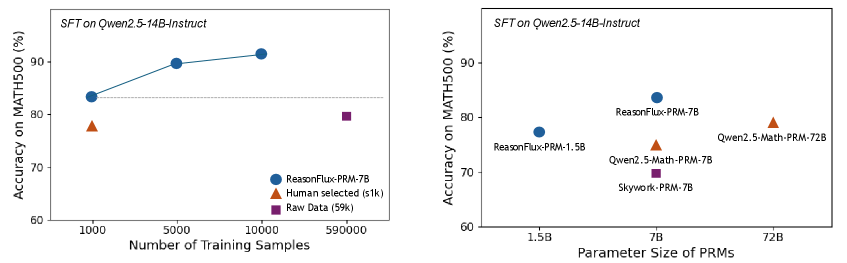
The image contains two visualizations comparing the performance of different models on the MATH500 benchmark. The left chart shows accuracy trends with varying training data sizes, while the right chart compares accuracy across models with different parameter sizes. Both charts use the same title and y-axis label ("Accuracy on MATH500 (%)").
### Components/Axes
#### Left Chart (Line Chart)
- **X-axis**: "Number of Training Samples" (logarithmic scale: 1k, 5k, 10k, 59k)
- **Y-axis**: "Accuracy on MATH500 (%)" (60–90%)
- **Legend**:
- Blue line: ReasonFlux-PRM-7B
- Orange triangle: Human selected (s1k)
- Purple square: Raw Data (59k)
#### Right Chart (Scatter Plot)
- **X-axis**: "Parameter Size of PRMs" (1.5B, 7B, 72B)
- **Y-axis**: "Accuracy on MATH500 (%)" (60–90%)
- **Legend**:
- Blue circles: ReasonFlux-PRM-1.5B, ReasonFlux-PRM-7B
- Orange triangles: Qwen2.5-Math-PRM-7B, Qwen2.5-Math-PRM-72B
- Purple square: Skywork-PRM-7B
### Detailed Analysis
#### Left Chart
- **ReasonFlux-PRM-7B (Blue Line)**:
- Starts at ~83% accuracy with 1k samples.
- Increases to ~90% at 10k samples.
- Continues upward trend (extrapolated to ~92% at 59k samples).
- **Human selected (s1k) (Orange Triangle)**:
- Fixed at ~77% accuracy with 1k samples.
- **Raw Data (59k) (Purple Square)**:
- Fixed at ~79% accuracy with 59k samples.
#### Right Chart
- **ReasonFlux-PRM-1.5B (Blue Circle)**:
- ~76% accuracy at 1.5B parameters.
- **ReasonFlux-PRM-7B (Blue Circle)**:
- ~83% accuracy at 7B parameters.
- **Qwen2.5-Math-PRM-7B (Orange Triangle)**:
- ~77% accuracy at 7B parameters.
- **Skywork-PRM-7B (Purple Square)**:
- ~74% accuracy at 7B parameters.
- **Qwen2.5-Math-PRM-72B (Orange Triangle)**:
- ~79% accuracy at 72B parameters.
### Key Observations
1. **Training Data Impact (Left Chart)**:
- ReasonFlux-PRM-7B shows a strong positive correlation between training samples and accuracy (83% → 90% with 1k → 10k samples).
- Human-selected data (s1k) underperforms compared to raw data (59k) despite similar parameter sizes.
2. **Parameter Size vs. Accuracy (Right Chart)**:
- Larger parameter sizes (72B) do not guarantee higher accuracy (79% vs. 83% for 7B models).
- ReasonFlux-PRM-7B (7B) outperforms Qwen2.5-Math-PRM-72B (72B) by 4%.
- Skywork-PRM-7B (7B) has the lowest accuracy (74%) among 7B models.
### Interpretation
- **Training Efficiency**: ReasonFlux-PRM-7B demonstrates that scaling training data significantly improves performance, suggesting data quality and quantity are critical for this model.
- **Parameter Size Limitations**: The right chart reveals that parameter size alone does not dictate accuracy. For example, the 72B model (Qwen2.5-Math-PRM-72B) underperforms the 7B ReasonFlux model, indicating architectural or training method differences may outweigh raw parameter count.
- **Model-Specific Trends**:
- ReasonFlux models (both 1.5B and 7B) show consistent performance gains with larger parameters.
- Qwen2.5-Math models (7B and 72B) exhibit diminishing returns, with the 72B model performing worse than the 7B variant.
- **Outliers**:
- The 72B Qwen model (79%) is an outlier in the right chart, performing better than the 1.5B ReasonFlux model (76%) but worse than the 7B ReasonFlux (83%).
- The human-selected data (s1k) in the left chart is an outlier in terms of low accuracy despite being a curated subset.
### Conclusion
The data highlights that **training data quantity and model architecture** are more influential than parameter size alone. ReasonFlux-PRM-7B achieves the highest accuracy (90%) with sufficient training, while larger models like Qwen2.5-Math-PRM-72B (72B) underperform smaller, well-trained models. This suggests that optimizing training strategies and model design is critical for achieving high performance on mathematical reasoning tasks.