\n
## Line Chart: N=10, CIFAR-10 Test Accuracy vs. Communication Round
### Overview
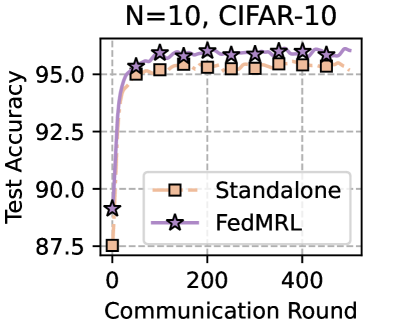
The image is a line chart comparing the test accuracy of two machine learning methods, "Standalone" and "FedMRL," over a series of communication rounds. The chart is titled "N=10, CIFAR-10," indicating the experiment likely involves 10 clients or participants (N=10) using the CIFAR-10 dataset. The plot shows both methods improving in accuracy as communication rounds increase, with FedMRL demonstrating a performance advantage, particularly in the early rounds.
### Components/Axes
* **Title:** "N=10, CIFAR-10" (centered at the top).
* **Y-Axis:** Labeled "Test Accuracy". The scale runs from approximately 87.5 to 95.0, with major tick marks at 87.5, 90.0, 92.5, and 95.0.
* **X-Axis:** Labeled "Communication Round". The scale runs from 0 to approximately 500, with major tick marks labeled at 0, 200, and 400.
* **Legend:** Positioned in the bottom-right quadrant of the chart area. It contains two entries:
* An orange square symbol labeled "Standalone".
* A purple star symbol labeled "FedMRL".
* **Data Series:**
1. **Standalone:** Represented by an orange line with square markers.
2. **FedMRL:** Represented by a purple line with star markers.
* **Grid:** A light gray dashed grid is present in the background.
### Detailed Analysis
**Trend Verification & Data Points (Approximate):**
* **Standalone (Orange Squares):**
* **Trend:** The line shows a steep, concave-down increase from round 0, then plateaus.
* **Data Points:**
* Round 0: ~87.5%
* Round ~50: ~94.0%
* Round ~100: ~95.0%
* Round ~150 to ~450: Hovers consistently around 95.0% - 95.5%.
* **FedMRL (Purple Stars):**
* **Trend:** The line shows an even steeper initial increase than Standalone, reaching a high accuracy faster, and then maintains a slight but consistent lead.
* **Data Points:**
* Round 0: ~89.0%
* Round ~50: ~95.0%
* Round ~100: ~95.5%
* Round ~150 to ~450: Maintains a level slightly above the Standalone line, approximately between 95.5% and 96.0%.
**Spatial Grounding:** The FedMRL (purple star) data points are consistently positioned vertically higher than the corresponding Standalone (orange square) data points at the same communication round, confirming its performance advantage as per the legend.
### Key Observations
1. **Initial Performance Gap:** At round 0, FedMRL starts at a higher accuracy (~89.0%) compared to Standalone (~87.5%).
2. **Convergence Speed:** FedMRL reaches the ~95.0% accuracy threshold significantly earlier (around round 50) than Standalone (around round 100).
3. **Final Performance Plateau:** Both methods plateau after approximately round 150. FedMRL maintains a small but consistent lead of roughly 0.5-1.0 percentage points in test accuracy over Standalone throughout the plateau phase.
4. **No Significant Degradation:** Neither method shows a decline in accuracy within the observed 450+ rounds, indicating stable training.
### Interpretation
The chart demonstrates the comparative effectiveness of the "FedMRL" federated learning method against a "Standalone" baseline on the CIFAR-10 image classification task with 10 participants.
* **What the data suggests:** FedMRL is more communication-efficient. It achieves high model accuracy (≥95%) in fewer communication rounds and sustains a slight performance edge. This implies that the FedMRL algorithm likely improves the learning process, possibly through better model aggregation or personalization, leading to a more accurate final global model with less communication overhead.
* **How elements relate:** The x-axis (Communication Round) represents the cost or time in a federated learning system. The y-axis (Test Accuracy) represents the primary performance metric. The relationship shows that investing communication rounds yields diminishing returns after about 150 rounds for both methods, but FedMRL extracts more value (accuracy) from each early round.
* **Notable patterns/anomalies:** The most notable pattern is the consistent, parallel plateau of both lines after round 150. This suggests that both methods have converged to their respective maximum achievable accuracies under the given experimental setup (N=10, CIFAR-10). The lack of crossover indicates FedMRL's advantage is robust throughout the training process. There are no anomalous drops or spikes, indicating stable experimental conditions.