\n
## Diagram: State Transition with Reward/Penalty
### Overview
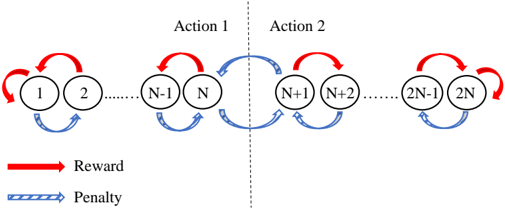
The image depicts a diagram illustrating a sequence of states numbered from 1 to 2N, connected by transitions representing actions. Each transition is associated with either a reward (red arrow) or a penalty (blue dashed arrow). A vertical dashed line separates the sequence into two sections labeled "Action 1" and "Action 2". The diagram appears to model a sequential decision-making process.
### Components/Axes
* **States:** Represented by circles numbered 1 through 2N.
* **Transitions:** Represented by arrows connecting adjacent states.
* **Reward:** Indicated by solid red arrows.
* **Penalty:** Indicated by dashed blue arrows.
* **Action 1:** Label above states N-1, N, N+1.
* **Action 2:** Label above states N+1, N+2, 2N-1.
* **Legend:** Located at the bottom-left corner, defining the meaning of the arrow styles.
### Detailed Analysis or Content Details
The diagram shows a linear sequence of 2N states. The transitions between states alternate between reward and penalty.
* **States 1-N:** Transitions from state *i* to *i+1* are associated with a reward (red arrow). Transitions from state *i+1* to *i* are associated with a penalty (blue dashed arrow).
* **States N+1-2N:** Transitions from state *i* to *i+1* are associated with a penalty (blue dashed arrow). Transitions from state *i+1* to *i* are associated with a reward (red arrow).
* The vertical dashed line separates the sequence at state N.
* The diagram shows a cyclical nature within each state pair (e.g., 1 <-> 2, N-1 <-> N, N+1 <-> N+2, etc.).
### Key Observations
* The reward/penalty structure is inverted between the first N states and the last N states.
* The diagram suggests a system where moving forward in the first half of the sequence is rewarded, while moving backward is penalized. The opposite is true for the second half of the sequence.
* The actions "Action 1" and "Action 2" seem to define the context for the reward/penalty structure.
### Interpretation
This diagram likely represents a reinforcement learning or Markov Decision Process (MDP) scenario. The states represent different conditions or positions within a system. The actions (Action 1 and Action 2) determine the reward/penalty structure for transitions between states. The inversion of the reward/penalty structure suggests a change in the optimal policy or goal after state N.
The diagram could model a scenario where an agent initially benefits from progressing through a sequence of states (Action 1), but then the optimal strategy changes, and the agent is rewarded for reversing course (Action 2). This could represent a task with a changing objective or a system with different constraints in different phases.
The cyclical nature of the transitions suggests that the agent can repeatedly move between adjacent states, accumulating rewards or penalties based on the current action context. The diagram does not provide specific numerical values for the rewards or penalties, but it clearly illustrates the qualitative relationship between states, actions, and outcomes.