## Scatter Plot: Correlation between Generation and Multiple Choice Scores
### Overview
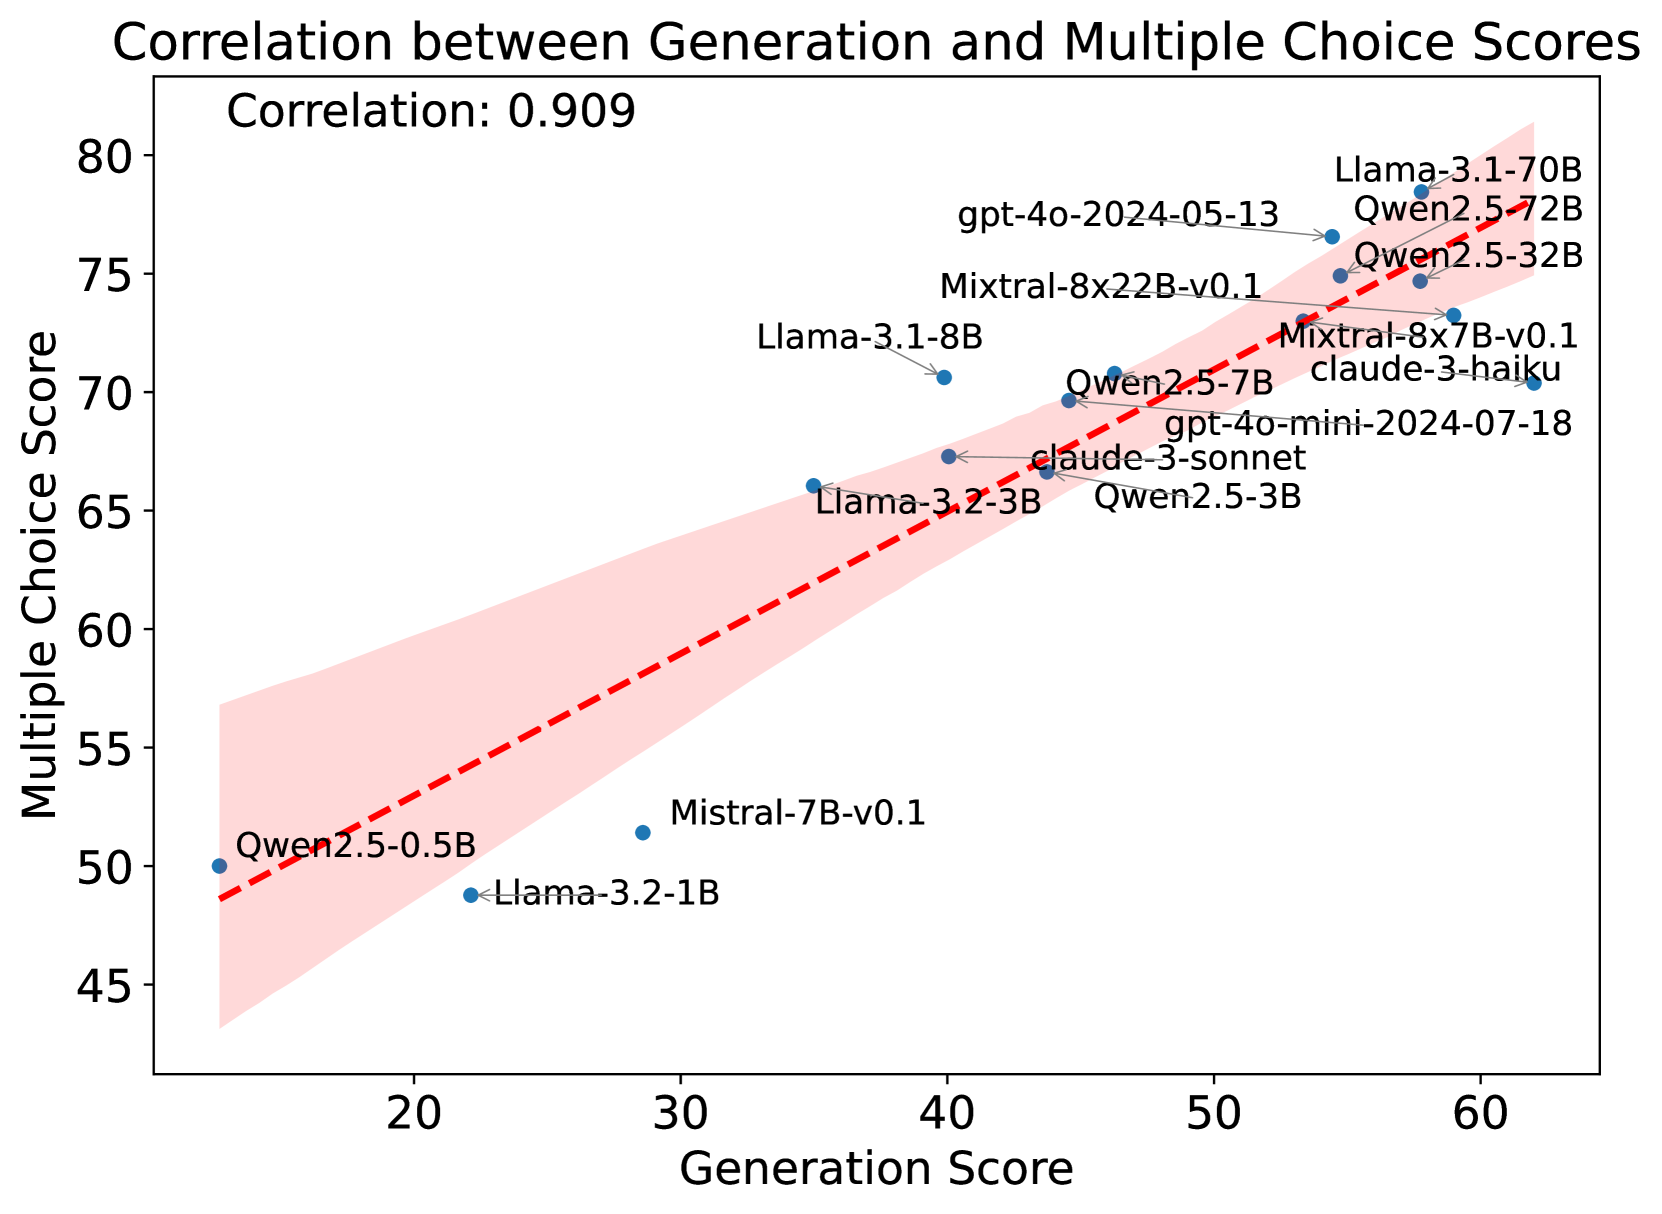
The image is a scatter plot showing the correlation between a "Generation Score" (x-axis) and a "Multiple Choice Score" (y-axis) for various language models. The plot includes individual data points for each model, a dashed red line indicating a linear trend, and a shaded red region representing the confidence interval around the trend line. The correlation coefficient is stated as 0.909.
### Components/Axes
* **Title:** Correlation between Generation and Multiple Choice Scores
* **Correlation Coefficient:** 0.909
* **X-axis:** Generation Score, ranging from approximately 10 to 60, with tick marks at intervals of 10.
* **Y-axis:** Multiple Choice Score, ranging from 45 to 80, with tick marks at intervals of 5.
* **Data Points:** Each data point represents a specific language model, labeled with its name (e.g., "Llama-3.1-70B", "Qwen2.5-0.5B").
* **Trend Line:** A dashed red line indicates the general trend of the data.
* **Confidence Interval:** A shaded red region around the trend line represents the confidence interval.
### Detailed Analysis or Content Details
**Data Points and their approximate coordinates:**
* **Qwen2.5-0.5B:** (15, 50)
* **Llama-3.2-1B:** (25, 48)
* **Mistral-7B-v0.1:** (30, 51)
* **Llama-3.2-3B:** (40, 65)
* **Llama-3.1-8B:** (38, 71)
* **Qwen2.5-3B:** (48, 66)
* **claude-3-sonnet:** (47, 68)
* **Qwen2.5-7B:** (48, 70)
* **gpt-4o-mini-2024-07-18:** (52, 69)
* **Mixtral-8x7B-v0.1:** (53, 73)
* **gpt-4o-2024-05-13:** (42, 75)
* **Mixtral-8x22B-v0.1:** (43, 74)
* **Qwen2.5-32B:** (58, 76)
* **Llama-3.1-70B:** (58, 79)
* **Qwen2.5-72B:** (58, 78)
* **Trend Line:** The dashed red line starts at approximately (10, 45) and extends to approximately (60, 62).
* **Confidence Interval:** The shaded red region widens as the Generation Score increases, indicating greater uncertainty in the prediction for higher generation scores.
### Key Observations
* There is a strong positive correlation (0.909) between Generation Score and Multiple Choice Score.
* The data points generally follow the trend line, but there is some scatter, indicating that Generation Score is not the only factor influencing Multiple Choice Score.
* The confidence interval widens at higher Generation Scores, suggesting that predictions become less precise as Generation Score increases.
* Some models, like "Mistral-7B-v0.1", deviate noticeably from the trend line, suggesting they may have different characteristics compared to other models.
### Interpretation
The scatter plot demonstrates a strong positive correlation between a model's "Generation Score" and its performance on multiple-choice questions. This suggests that, in general, models with higher generation scores tend to perform better on multiple-choice tasks. However, the scatter of the data points and the widening confidence interval indicate that other factors also play a role in determining a model's multiple-choice performance. The specific model architectures, training data, and fine-tuning strategies likely contribute to the observed variations. The outlier models, such as "Mistral-7B-v0.1", warrant further investigation to understand why their performance deviates from the general trend.