## Line Chart: CIFAR-100 Test Accuracy vs. d₁
### Overview
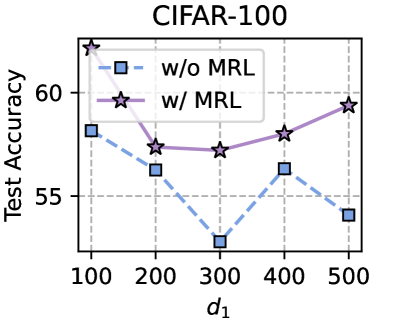
The image is a line chart comparing the test accuracy on the CIFAR-100 dataset for two different methods across a range of a parameter labeled `d₁`. The chart demonstrates the performance impact of a technique referred to as "MRL".
### Components/Axes
* **Chart Title:** "CIFAR-100" (centered at the top).
* **Y-Axis:**
* **Label:** "Test Accuracy" (rotated vertically on the left).
* **Scale:** Linear scale ranging from 55 to 60, with major tick marks at 55, 60.
* **X-Axis:**
* **Label:** "d₁" (centered at the bottom).
* **Scale:** Linear scale with discrete values: 100, 200, 300, 400, 500.
* **Legend:** Positioned in the top-left corner of the chart area.
* **Entry 1:** "w/o MRL" - Represented by a blue square marker (■) connected by a blue dashed line.
* **Entry 2:** "w/ MRL" - Represented by a purple star marker (★) connected by a purple solid line.
* **Grid:** A light gray grid is present in the background.
### Detailed Analysis
**Data Series 1: "w/o MRL" (Blue Squares, Dashed Line)**
* **Trend:** The line shows a general downward trend from d₁=100 to d₁=300, followed by a partial recovery and then another decline.
* **Data Points (Approximate):**
* d₁ = 100: Test Accuracy ≈ 58.0
* d₁ = 200: Test Accuracy ≈ 56.0
* d₁ = 300: Test Accuracy ≈ 53.0 (This is the lowest point for this series).
* d₁ = 400: Test Accuracy ≈ 56.0
* d₁ = 500: Test Accuracy ≈ 54.0
**Data Series 2: "w/ MRL" (Purple Stars, Solid Line)**
* **Trend:** The line shows a sharp initial drop from d₁=100 to d₁=200, then remains relatively stable with a slight upward trend from d₁=300 to d₁=500.
* **Data Points (Approximate):**
* d₁ = 100: Test Accuracy ≈ 62.0 (This is the highest point on the entire chart).
* d₁ = 200: Test Accuracy ≈ 57.0
* d₁ = 300: Test Accuracy ≈ 57.0
* d₁ = 400: Test Accuracy ≈ 58.0
* d₁ = 500: Test Accuracy ≈ 59.0
### Key Observations
1. **Performance Gap:** The "w/ MRL" method consistently achieves higher test accuracy than the "w/o MRL" method at every measured value of `d₁`.
2. **Divergent Behavior at d₁=300:** The most significant performance gap occurs at `d₁=300`, where "w/o MRL" hits its minimum (~53) while "w/ MRL" maintains a stable accuracy (~57).
3. **Trend Reversal:** After `d₁=300`, the "w/ MRL" series shows a clear improving trend, while the "w/o MRL" series is volatile and ends lower than it started.
4. **Peak Performance:** The absolute highest accuracy is achieved by the "w/ MRL" method at the smallest parameter value (`d₁=100`).
### Interpretation
This chart presents an ablation study or hyperparameter analysis for a machine learning model on the CIFAR-100 image classification task. The parameter `d₁` likely represents a dimensionality or capacity-related hyperparameter (e.g., embedding dimension, number of channels, or a rank in a low-rank adaptation method).
The data strongly suggests that incorporating the "MRL" technique provides two key benefits:
1. **Robustness:** It prevents the severe performance degradation seen in the baseline ("w/o MRL") at intermediate values of `d₁` (specifically around 300).
2. **Improved Scaling:** It enables the model to effectively utilize larger values of `d₁` (400, 500) to recover and even improve accuracy, whereas the baseline model's performance deteriorates.
The investigation implies that "MRL" is a beneficial regularization or architectural component that stabilizes training and leads to better generalization across a wider range of model configurations. The sharp drop for both methods from `d₁=100` to `d₁=200` may indicate an initial overfitting or optimization challenge that is more pronounced without MRL.