## Line Charts: Llama-3.2-1B and Llama-3.2-3B Answer Accuracy vs. Layer
### Overview
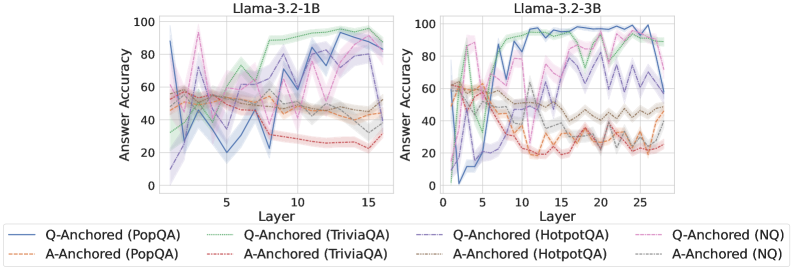
The image contains two line charts comparing the answer accuracy of Llama-3.2-1B and Llama-3.2-3B models across different layers. The x-axis represents the layer number, and the y-axis represents the answer accuracy. Each chart displays six data series, representing different question-answering datasets (PopQA, TriviaQA, HotpotQA, and NQ) and anchoring methods (Q-Anchored and A-Anchored). The charts show how accuracy changes as the input progresses through the layers of the model.
### Components/Axes
* **Titles:**
* Left Chart: "Llama-3.2-1B"
* Right Chart: "Llama-3.2-3B"
* **X-axis:**
* Label: "Layer"
* Left Chart: Scale from 0 to 15, with tick marks at approximately 0, 5, 10, and 15.
* Right Chart: Scale from 0 to 25, with tick marks at approximately 0, 5, 10, 15, 20, and 25.
* **Y-axis:**
* Label: "Answer Accuracy"
* Scale: 0 to 100, with tick marks at 0, 20, 40, 60, 80, and 100.
* **Legend:** Located at the bottom of the image, shared by both charts.
* **Q-Anchored (PopQA):** Solid blue line
* **A-Anchored (PopQA):** Dashed brown line
* **Q-Anchored (TriviaQA):** Dotted green line
* **A-Anchored (TriviaQA):** Dotted-dashed red line
* **Q-Anchored (HotpotQA):** Solid light blue line
* **A-Anchored (HotpotQA):** Dashed orange line
* **Q-Anchored (NQ):** Dotted-dashed pink line
* **A-Anchored (NQ):** Dotted gray line
### Detailed Analysis
**Left Chart: Llama-3.2-1B**
* **Q-Anchored (PopQA):** (Solid blue line) Starts high (around 90% at layer 1), drops sharply to around 20% at layer 5, then fluctuates between 30% and 80% for the remaining layers.
* **A-Anchored (PopQA):** (Dashed brown line) Starts around 60% and generally remains between 40% and 60% across all layers.
* **Q-Anchored (TriviaQA):** (Dotted green line) Starts around 50%, increases to around 70% by layer 8, and then fluctuates between 60% and 75% for the remaining layers.
* **A-Anchored (TriviaQA):** (Dotted-dashed red line) Starts around 60%, decreases to around 30% by layer 10, and then remains relatively stable between 30% and 40% for the remaining layers.
* **Q-Anchored (HotpotQA):** (Solid light blue line) Starts around 60%, increases to around 90% by layer 12, and then fluctuates between 80% and 95% for the remaining layers.
* **A-Anchored (HotpotQA):** (Dashed orange line) Starts around 60%, decreases to around 40% by layer 5, and then remains relatively stable between 40% and 50% for the remaining layers.
* **Q-Anchored (NQ):** (Dotted-dashed pink line) Starts around 60%, fluctuates significantly, reaching peaks around 90% and valleys around 50%, ending around 90%.
* **A-Anchored (NQ):** (Dotted gray line) Starts around 60%, fluctuates between 40% and 60% across all layers.
**Right Chart: Llama-3.2-3B**
* **Q-Anchored (PopQA):** (Solid blue line) Starts high (around 60% at layer 1), drops sharply to around 5% at layer 4, then fluctuates between 10% and 40% for the remaining layers.
* **A-Anchored (PopQA):** (Dashed brown line) Starts around 60% and generally remains between 40% and 60% across all layers.
* **Q-Anchored (TriviaQA):** (Dotted green line) Starts around 60%, increases to around 95% by layer 8, and then fluctuates between 90% and 100% for the remaining layers.
* **A-Anchored (TriviaQA):** (Dotted-dashed red line) Starts around 60%, decreases to around 20% by layer 10, and then remains relatively stable between 20% and 30% for the remaining layers.
* **Q-Anchored (HotpotQA):** (Solid light blue line) Starts around 60%, increases to around 90% by layer 8, and then fluctuates between 80% and 95% for the remaining layers.
* **A-Anchored (HotpotQA):** (Dashed orange line) Starts around 60%, decreases to around 20% by layer 5, and then remains relatively stable between 20% and 30% for the remaining layers.
* **Q-Anchored (NQ):** (Dotted-dashed pink line) Starts around 60%, fluctuates significantly, reaching peaks around 90% and valleys around 50%, ending around 90%.
* **A-Anchored (NQ):** (Dotted gray line) Starts around 60%, fluctuates between 40% and 60% across all layers.
### Key Observations
* For both models, Q-Anchored (PopQA) shows a significant drop in accuracy in the initial layers.
* Q-Anchored (TriviaQA) and Q-Anchored (HotpotQA) generally show increasing accuracy as the layer number increases, especially in the Llama-3.2-3B model.
* A-Anchored (TriviaQA) and A-Anchored (HotpotQA) show a decrease in accuracy as the layer number increases.
* The Llama-3.2-3B model generally achieves higher accuracy for Q-Anchored (TriviaQA) and Q-Anchored (HotpotQA) compared to the Llama-3.2-1B model.
* The shaded regions around each line indicate the variance or uncertainty in the accuracy measurements.
### Interpretation
The charts illustrate the performance of two Llama models on different question-answering tasks, highlighting the impact of layer depth and anchoring method on answer accuracy. The Q-Anchored methods for TriviaQA and HotpotQA appear to benefit from deeper layers, particularly in the Llama-3.2-3B model, suggesting that increased model complexity can improve performance on these tasks. Conversely, the A-Anchored methods for TriviaQA and HotpotQA show a decline in accuracy with increasing layer depth, indicating that the answer anchoring strategy may not be as effective in deeper layers. The significant drop in accuracy for Q-Anchored (PopQA) in the initial layers suggests that this task may require different processing strategies or model architectures. The fluctuations in accuracy across layers indicate that the model's performance is not consistently improving with depth and may be sensitive to specific layer configurations.