TECHNICAL ASSET FINGERPRINT
8228cbdc8a8b4c97d27f21bd
Click to view fullscreen
Press ESC or click to close
FOUND IN PAPERS
EXPERT: healer-alpha-free VERSION 1
RUNTIME: free/openrouter/healer-alpha
INTEL_VERIFIED
## Line Charts: Brain Alignment Across Pythia Model Sizes During Training
### Overview
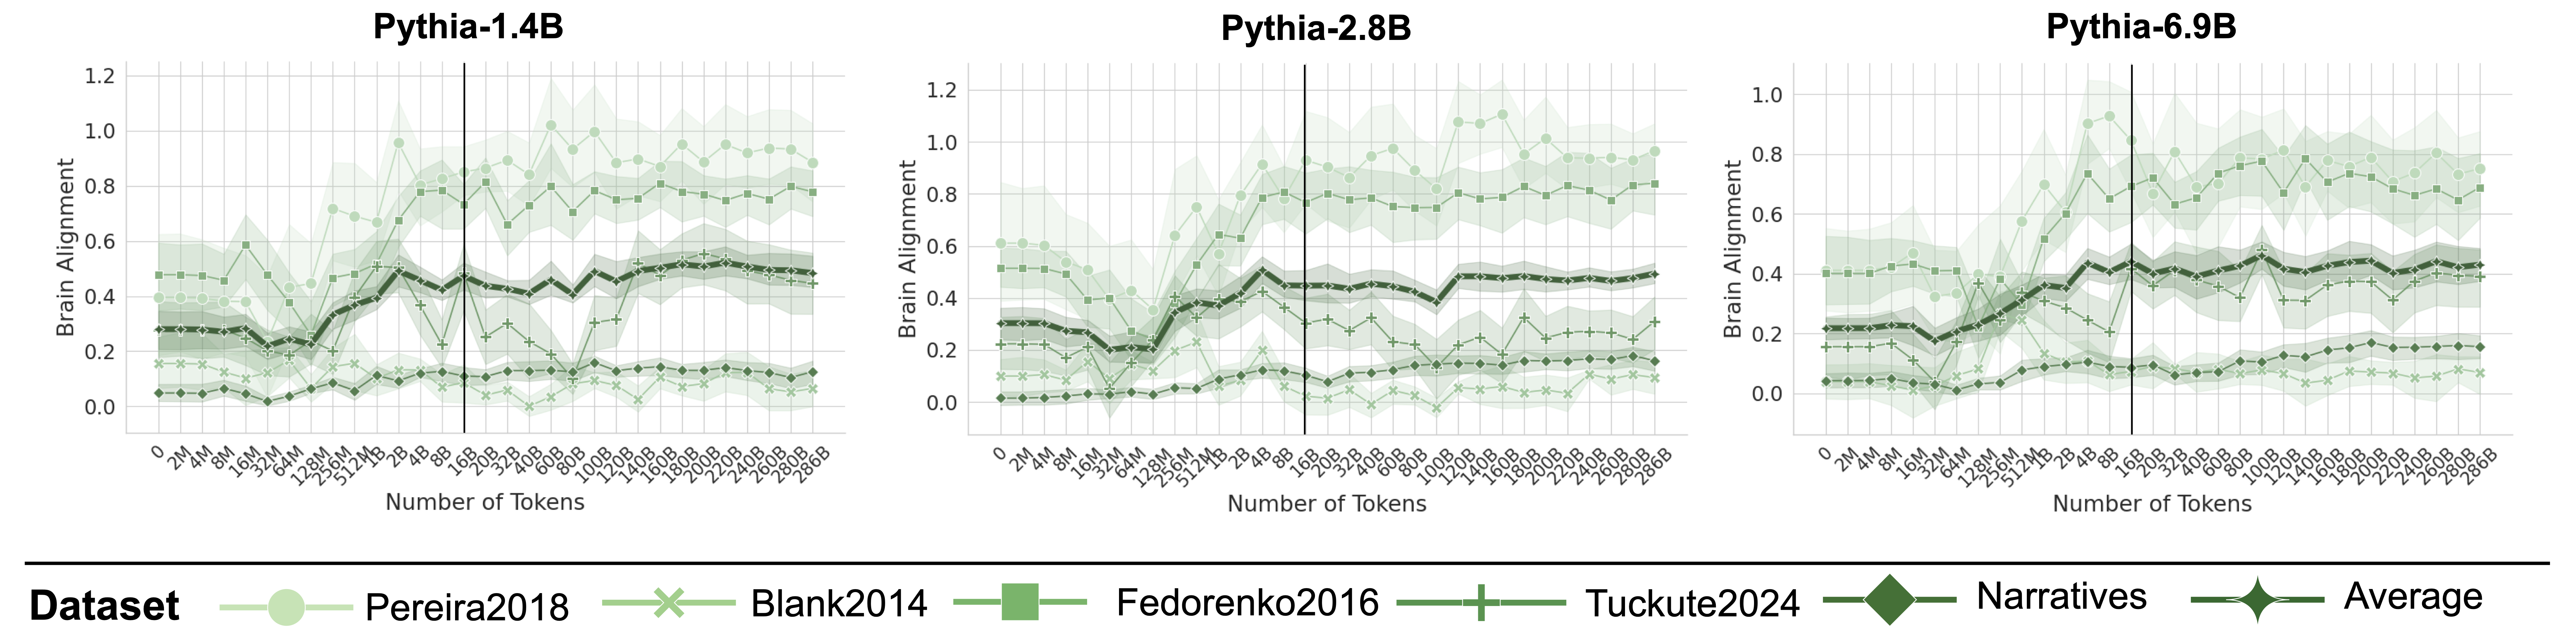
The image displays three side-by-line charts, each tracking the "Brain Alignment" metric for a different-sized Pythia language model (1.4B, 2.8B, and 6.9B parameters) as a function of the number of training tokens processed. The charts compare performance across six different evaluation datasets. A shared legend is positioned at the bottom of the entire figure.
### Components/Axes
* **Titles:** Each subplot has a title at the top center: "Pythia-1.4B", "Pythia-2.8B", "Pythia-6.9B".
* **Y-Axis (All Charts):** Labeled "Brain Alignment". The scale ranges from 0.0 to 1.2 for the first two charts and 0.0 to 1.0 for the third (Pythia-6.9B). Major gridlines are at 0.2 intervals.
* **X-Axis (All Charts):** Labeled "Number of Tokens". It uses a logarithmic scale with major tick marks at: 0, 2M, 4M, 8M, 16M, 32M, 64M, 128M, 256M, 512M, 1B, 2B, 4B, 8B, 16B, 20B, 32B, 40B, 60B, 80B, 100B, 120B, 140B, 160B, 180B, 200B, 220B, 240B, 260B, 280B, 286B. A prominent vertical black line is drawn at the 16B token mark in each chart.
* **Legend (Bottom Center):** A horizontal legend titled "Dataset" defines six data series with distinct colors and markers:
1. **Pereira2018:** Light green line with circle markers.
2. **Blank2014:** Light green line with 'x' markers.
3. **Fedorenko2016:** Medium green line with square markers.
4. **Tuckute2024:** Dark green line with plus ('+') markers.
5. **Narratives:** Darkest green line with diamond markers.
6. **Average:** Darkest green line with star/asterisk markers.
* **Data Representation:** Each dataset is plotted as a line with markers at data points, surrounded by a shaded band of the same color, likely representing confidence intervals or standard deviation.
### Detailed Analysis
**Trend Verification & Data Points (Approximate Values):**
* **General Trend Across All Charts:** Most lines show an initial increase in Brain Alignment as training progresses, followed by a plateau or slower growth after approximately 4B-16B tokens. The "Pereira2018" dataset consistently achieves the highest alignment scores, while "Blank2014" and "Narratives" are consistently among the lowest.
* **Pythia-1.4B Chart:**
* **Pereira2018 (Circles):** Starts ~0.4, rises sharply after 1B tokens, peaks near 1.0 around 80B-100B tokens, then fluctuates between 0.8-1.0.
* **Fedorenko2016 (Squares):** Starts ~0.5, shows a moderate increase, stabilizing around 0.7-0.8 after 16B tokens.
* **Tuckute2024 (Pluses):** Starts ~0.3, increases to ~0.5 by 16B tokens, then plateaus between 0.4-0.6.
* **Average (Stars):** Follows a similar path to Tuckute2024, starting ~0.3 and stabilizing around 0.5.
* **Blank2014 (X's) & Narratives (Diamonds):** Both start low (~0.1-0.2) and show only a slight increase, remaining below 0.2 for most of training.
* **Pythia-2.8B Chart:**
* **Pereira2018 (Circles):** Starts ~0.6, climbs steadily, surpassing 1.0 after 80B tokens and reaching near 1.1 by 286B.
* **Fedorenko2016 (Squares):** Starts ~0.5, rises to ~0.8 by 16B tokens and remains stable.
* **Tuckute2024 (Pluses) & Average (Stars):** Both start ~0.3, rise to ~0.5 by 16B tokens, and plateau.
* **Blank2014 (X's) & Narratives (Diamonds):** Remain very low, mostly below 0.2, with a slight upward trend.
* **Pythia-6.9B Chart (Y-axis max 1.0):**
* **Pereira2018 (Circles):** Starts ~0.4, shows a strong increase, crossing 0.8 by 16B tokens and fluctuating between 0.8-1.0 thereafter.
* **Fedorenko2016 (Squares):** Starts ~0.4, rises to ~0.7 by 16B tokens, then stabilizes between 0.6-0.8.
* **Tuckute2024 (Pluses) & Average (Stars):** Start ~0.2, increase to ~0.4 by 16B tokens, and plateau around 0.4-0.5.
* **Blank2014 (X's) & Narratives (Diamonds):** Start near 0.0-0.1, show minimal growth, and remain below 0.2.
### Key Observations
1. **Dataset Hierarchy:** A clear and consistent performance hierarchy exists across all model sizes: Pereira2018 > Fedorenko2016 > Tuckute2024 ≈ Average > Narratives ≈ Blank2014.
2. **Model Size Effect:** Larger models (2.8B, 6.9B) achieve higher peak alignment scores on the top-performing datasets (Pereira2018, Fedorenko2016) compared to the 1.4B model. The gap between the best and worst datasets also appears more pronounced in larger models.
3. **Training Phase Transition:** The vertical line at 16B tokens often marks a point where the rate of improvement slows or plateaus for many datasets, suggesting a potential phase change in what the models are learning relative to brain alignment.
4. **High Variance:** The shaded confidence bands are notably wide, especially for the Pereira2018 dataset in the later stages of training, indicating significant variability in the alignment metric across different evaluation runs or subjects.
### Interpretation
This data suggests that the ability of Pythia language models to align with human brain activity (as measured by these specific datasets) is highly dependent on both the **evaluation dataset** and the **amount of training**.
* **Dataset Specificity:** The stark performance differences imply that "brain alignment" is not a monolithic property. The models align much better with the neural patterns captured in the Pereira2018 dataset than with those in Blank2014 or Narratives. This could reflect differences in the cognitive tasks, brain regions, or experimental paradigms used in the original studies.
* **Learning Trajectory:** Alignment improves with scale (both model size and training tokens), but with diminishing returns. The most rapid gains occur in the first few billion tokens, after which improvements become marginal. This mirrors the general "scaling laws" for language model performance but applied to a neuroscientific metric.
* **The 16B Token Milestone:** The consistent inflection around 16B tokens may indicate the point where models have largely captured the coarse-grained, easily learnable correspondences between language and brain activity, and further training refines more subtle or complex mappings.
* **Implication for AGI:** From a Peircean perspective, this chart maps the evolving "representation" (the model's internal states) of the "object" (the brain's processing of language). The high alignment on specific datasets suggests the models are successfully learning some of the statistical regularities that underpin human neural language processing. However, the low alignment on other datasets highlights that current models are not yet capturing the full richness or diversity of human brain-language relationships. The investigation would question: Are the high-alignment datasets simply easier to model, or do they represent more fundamental aspects of language processing that AGI should prioritize?
DECODING INTELLIGENCE...