\n
## Scatter Plot: Machine Learning Confidence vs. Target Length
### Overview
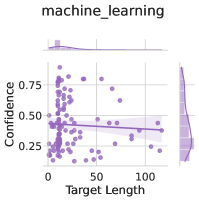
The image presents a scatter plot visualizing the relationship between "Target Length" and "Confidence" in a machine learning context. A regression line is overlaid on the scatter points, along with marginal distributions (histograms) along the top and right edges of the plot. The plot suggests a potential negative correlation between target length and confidence, though the relationship appears weak and noisy.
### Components/Axes
* **Title:** "machine\_learning" (top-center)
* **X-axis:** "Target Length" (bottom-center), ranging from approximately 0 to 110.
* **Y-axis:** "Confidence" (left-center), ranging from approximately 0.20 to 0.75.
* **Scatter Points:** Numerous purple dots representing individual data points.
* **Regression Line:** A purple line representing the trend of the data.
* **Marginal Distribution (Top):** A histogram showing the distribution of "Target Length".
* **Marginal Distribution (Right):** A histogram showing the distribution of "Confidence".
* **Shaded Area:** A light purple shaded area around the regression line, representing the confidence interval.
### Detailed Analysis
The scatter plot shows a generally downward trend, but with significant scatter.
* **Regression Line Trend:** The regression line slopes slightly downward, indicating a negative correlation.
* **Data Point Distribution:**
* At Target Length = 0, Confidence values range from approximately 0.20 to 0.70, with a high density of points around 0.25-0.35.
* As Target Length increases to approximately 50, Confidence values are more dispersed, ranging from approximately 0.20 to 0.60, with a concentration around 0.40-0.50.
* For Target Length values greater than 50, the data becomes sparse, with Confidence values generally below 0.50.
* At Target Length = 100, Confidence values range from approximately 0.20 to 0.40.
* **Marginal Distribution (Target Length):** The distribution of Target Length is skewed to the right, with a peak near 0 and a long tail extending to higher values.
* **Marginal Distribution (Confidence):** The distribution of Confidence is roughly unimodal, with a peak around 0.40.
### Key Observations
* The relationship between Target Length and Confidence is weak and noisy. The regression line explains only a small portion of the variance in Confidence.
* There is a higher concentration of data points at lower Target Length values.
* Confidence tends to decrease as Target Length increases, but the effect is not strong.
* The marginal distributions reveal that Target Length is more variable than Confidence.
### Interpretation
The data suggests that longer target lengths may be associated with lower confidence scores in the machine learning model. However, this relationship is not strong, and other factors likely play a significant role in determining confidence. The weak correlation could be due to several reasons:
* The model may be less accurate on longer targets.
* The model may be more uncertain about longer targets.
* The data may be noisy or contain outliers.
The marginal distributions indicate that the model is exposed to a wider range of target lengths than confidence scores. This could be due to the way the data was collected or generated. The histograms show that the model is more frequently exposed to shorter target lengths.
Further investigation is needed to understand the underlying reasons for the observed relationship and to improve the model's performance on longer targets. It would be useful to examine the data more closely, consider other relevant variables, and explore different modeling techniques.