## Histogram: Reward Score Distribution Comparison
### Overview
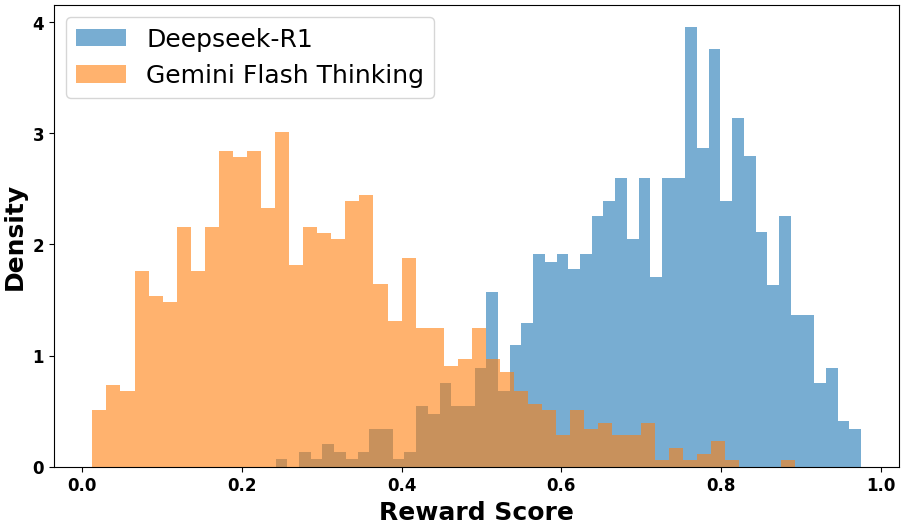
The image displays a comparative histogram showing the distribution of reward scores for two AI models: Deepseek-R1 (blue) and Gemini Flash Thinking (orange). The x-axis represents reward scores (0.0–1.0), and the y-axis represents density (0–4). The distributions overlap between 0.4–0.6, with distinct peaks in separate regions.
### Components/Axes
- **X-axis (Reward Score)**: Labeled "Reward Score," scaled from 0.0 to 1.0 in increments of 0.2.
- **Y-axis (Density)**: Labeled "Density," scaled from 0 to 4 in increments of 1.
- **Legend**: Located in the top-left corner, with:
- Blue: Deepseek-R1
- Orange: Gemini Flash Thinking
### Detailed Analysis
1. **Deepseek-R1 (Blue)**:
- **Peak Density**: ~3.5 at reward score ~0.75.
- **Spread**: Distinct bimodal distribution with secondary peaks near 0.6 and 0.85.
- **Tail Behavior**: Extends to ~0.95 with low-density tails.
- **Overlap Region**: Minimal overlap with Gemini Flash Thinking (0.4–0.6), where density drops to ~0.5.
2. **Gemini Flash Thinking (Orange)**:
- **Peak Density**: ~2.5 at reward score ~0.3.
- **Spread**: Unimodal distribution with a sharp decline after 0.4.
- **Tail Behavior**: Tapers off sharply below 0.5, with negligible density beyond 0.6.
- **Overlap Region**: Overlaps with Deepseek-R1 in 0.4–0.6, but with much lower combined density (~1.0).
### Key Observations
- **Distinct Peaks**: Deepseek-R1 dominates higher reward scores (0.6–0.9), while Gemini Flash Thinking concentrates in lower scores (0.0–0.4).
- **Overlap Region**: Both models show weak performance between 0.4–0.6, but Deepseek-R1 maintains higher density here.
- **Tail Differences**: Deepseek-R1 exhibits a long right tail (up to 0.95), suggesting occasional high-reward outliers, whereas Gemini Flash Thinking has no significant tail beyond 0.6.
### Interpretation
The data suggests **Deepseek-R1 consistently outperforms Gemini Flash Thinking in reward scores**, with a clear dominance in the 0.6–0.9 range. The overlap region (0.4–0.6) indicates a narrow band of comparable performance, but Gemini Flash Thinking lacks the capacity to achieve the highest rewards. The sharp decline in Gemini’s distribution after 0.4 implies a fundamental limitation in reaching higher reward thresholds, while Deepseek-R1’s bimodal structure hints at specialized capabilities for high-reward scenarios. This could reflect architectural differences, training data, or optimization strategies between the models.