## Bar Chart: Evaluation on Verification and Correction (Base Model: Qwen2-7B-Instruct)
### Overview
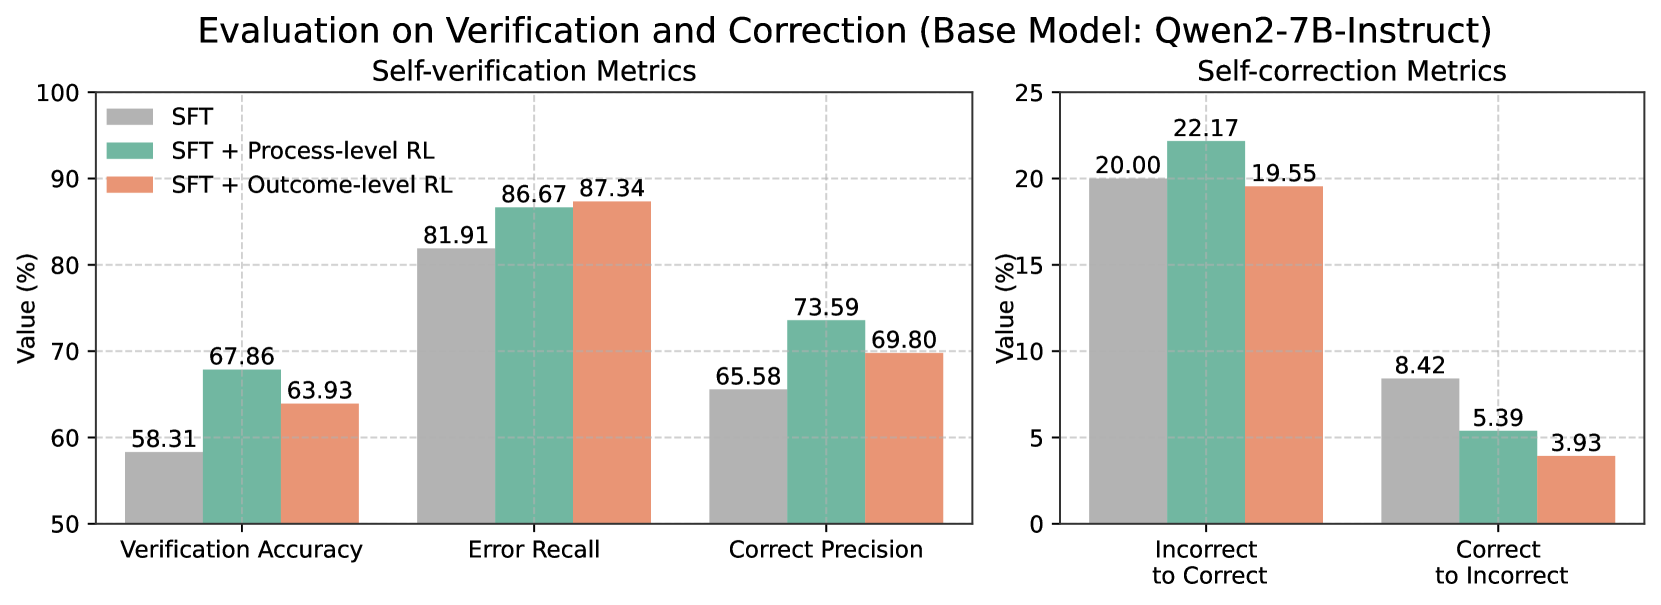
The image displays a comparative bar chart evaluating the performance of three different training methods applied to the base language model "Qwen2-7B-Instruct". The evaluation is split into two distinct metric groups: "Self-verification Metrics" (left panel) and "Self-correction Metrics" (right panel). The chart compares the performance of Supervised Fine-Tuning (SFT) alone against SFT combined with two types of Reinforcement Learning (RL): Process-level RL and Outcome-level RL.
### Components/Axes
* **Main Title:** "Evaluation on Verification and Correction (Base Model: Qwen2-7B-Instruct)"
* **Left Panel Title:** "Self-verification Metrics"
* **Right Panel Title:** "Self-correction Metrics"
* **Y-Axis (Both Panels):** Labeled "Value (%)". The left panel's axis ranges from 50 to 100 in increments of 10. The right panel's axis ranges from 0 to 25 in increments of 5.
* **X-Axis (Left Panel):** Three metric categories: "Verification Accuracy", "Error Recall", and "Correct Precision".
* **X-Axis (Right Panel):** Two metric categories: "Incorrect to Correct" and "Correct to Incorrect".
* **Legend (Top-Left of Left Panel):** A color-coded legend identifies the three training methods:
* **Grey Bar:** SFT
* **Teal/Green Bar:** SFT + Process-level RL
* **Salmon/Orange Bar:** SFT + Outcome-level RL
### Detailed Analysis
**Self-verification Metrics (Left Panel):**
This panel shows the model's ability to verify its own outputs. For all three metrics, the RL-enhanced methods outperform the SFT baseline.
1. **Verification Accuracy:**
* SFT (Grey): 58.31%
* SFT + Process-level RL (Teal): 67.86%
* SFT + Outcome-level RL (Salmon): 63.93%
* *Trend:* Both RL methods improve accuracy, with Process-level RL showing the largest gain.
2. **Error Recall:**
* SFT (Grey): 81.91%
* SFT + Process-level RL (Teal): 86.67%
* SFT + Outcome-level RL (Salmon): 87.34%
* *Trend:* All methods score highly. The RL methods provide a modest improvement over SFT, with Outcome-level RL performing slightly better.
3. **Correct Precision:**
* SFT (Grey): 65.58%
* SFT + Process-level RL (Teal): 73.59%
* SFT + Outcome-level RL (Salmon): 69.80%
* *Trend:* RL methods improve precision. Process-level RL shows the most significant improvement.
**Self-correction Metrics (Right Panel):**
This panel measures the model's ability to correct its own outputs. The trends here are more varied.
1. **Incorrect to Correct:**
* SFT (Grey): 20.00%
* SFT + Process-level RL (Teal): 22.17%
* SFT + Outcome-level RL (Salmon): 19.55%
* *Trend:* Process-level RL improves the rate of correcting incorrect answers. Outcome-level RL performs slightly worse than the SFT baseline.
2. **Correct to Incorrect:**
* SFT (Grey): 8.42%
* SFT + Process-level RL (Teal): 5.39%
* SFT + Outcome-level RL (Salmon): 3.93%
* *Trend:* This is a negative metric (lower is better). Both RL methods significantly reduce the rate of corrupting correct answers, with Outcome-level RL showing the best (lowest) result.
### Key Observations
* **Consistent Improvement in Verification:** All three verification metrics (Accuracy, Error Recall, Correct Precision) show improvement when RL is applied to the SFT baseline.
* **Divergent Impact on Correction:** The effect of RL on correction is metric-dependent. Process-level RL improves the "Incorrect to Correct" rate, while both RL methods excel at reducing the "Correct to Incorrect" error rate.
* **Process-level vs. Outcome-level RL:** Process-level RL generally provides the largest boost to verification metrics and the "Incorrect to Correct" correction metric. Outcome-level RL is particularly effective at minimizing the "Correct to Incorrect" error.
* **Scale Difference:** The values for self-verification metrics (50-90% range) are substantially higher than those for self-correction metrics (4-22% range), indicating the model is better at verifying outputs than actively correcting them.
### Interpretation
The data suggests that integrating Reinforcement Learning (RL) with Supervised Fine-Tuning (SFT) enhances the self-evaluation capabilities of the Qwen2-7B-Instruct model. The core finding is that RL training, whether focused on the process or the outcome, makes the model more reliable at identifying errors (higher Verification Accuracy and Error Recall) and more precise in its judgments (higher Correct Precision).
The correction metrics reveal a more nuanced picture. The model's ability to fix its own mistakes ("Incorrect to Correct") sees a moderate boost primarily from Process-level RL. More importantly, both RL methods drastically reduce the harmful behavior of changing correct answers into incorrect ones ("Correct to Incorrect"). This indicates that RL training instills a more conservative and confident correction behavior, making the model less likely to "over-correct" and introduce new errors.
In summary, the chart demonstrates that RL-augmented training produces a model that is not only better at judging the correctness of its outputs but also safer and more reliable when attempting to correct them, with a notable reduction in harmful interventions. The choice between Process-level and Outcome-level RL may depend on whether the primary goal is improving active correction or minimizing correction-induced errors.