## Scatter Plots: Energy Distribution and Autocorrelation Function (ACF)
### Overview
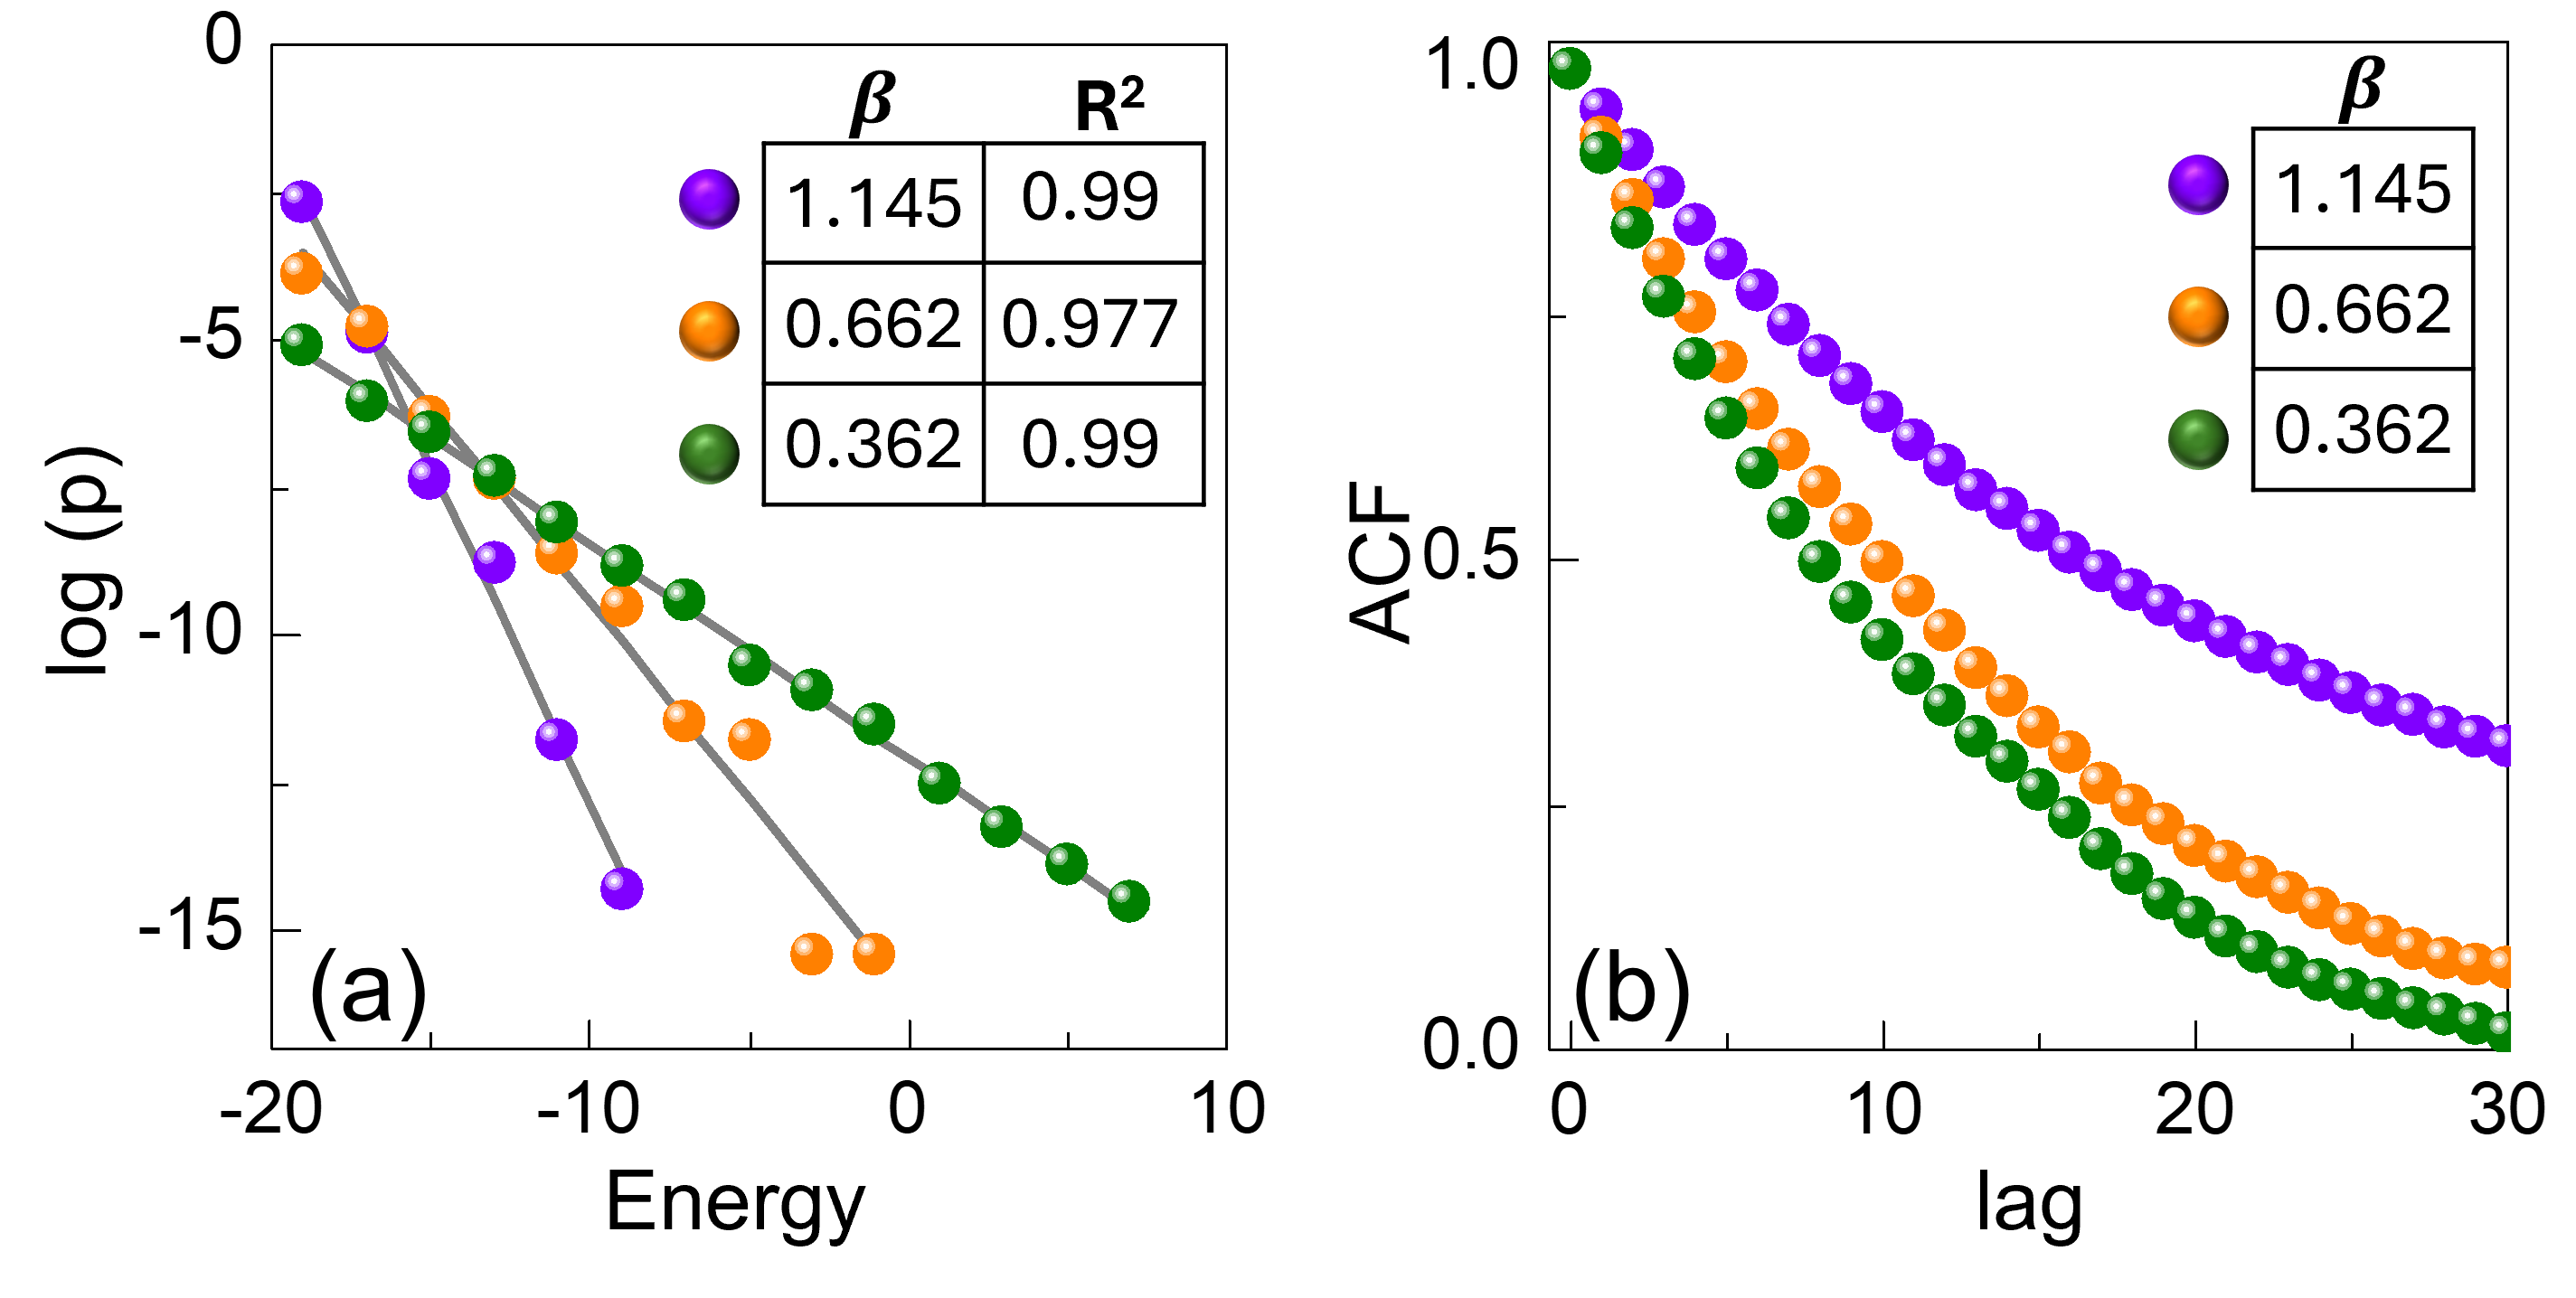
The image displays two distinct scatter plots, labeled (a) and (b), which analyze the relationship between three data series identified by color (Purple, Orange, Green).
* **Plot (a)** illustrates a linear relationship between "log (p)" and "Energy," including a data table with $\beta$ and $R^2$ values.
* **Plot (b)** illustrates the decay of the "ACF" (Autocorrelation Function) over "lag."
Both plots share the same color-coded series, which correspond to specific $\beta$ values:
* **Purple:** $\beta = 1.145$
* **Orange:** $\beta = 0.662$
* **Green:** $\beta = 0.362$
---
### Components/Axes
#### Plot (a) - Left
* **Y-Axis:** Labeled "log (p)". Scale ranges from 0 to -15, with major ticks at 0, -5, -10, -15.
* **X-Axis:** Labeled "Energy". Scale ranges from -20 to 10, with major ticks at -20, -10, 0, 10.
* **Legend/Table:** Located in the top-right quadrant of the plot area. It is a 3x2 table (excluding headers) mapping the color-coded $\beta$ values to $R^2$ values.
| Series | $\beta$ | $R^2$ |
| :--- | :--- | :--- |
| Purple | 1.145 | 0.99 |
| Orange | 0.662 | 0.977 |
| Green | 0.362 | 0.99 |
#### Plot (b) - Right
* **Y-Axis:** Labeled "ACF". Scale ranges from 0.0 to 1.0, with major ticks at 0.0, 0.5, 1.0.
* **X-Axis:** Labeled "lag". Scale ranges from 0 to 30, with major ticks at 0, 10, 20, 30.
* **Legend:** Located in the top-right quadrant of the plot area. It lists the color-coded $\beta$ values:
* Purple: $\beta = 1.145$
* Orange: $\beta = 0.662$
* Green: $\beta = 0.362$
---
### Detailed Analysis
#### Plot (a): log(p) vs. Energy
All three series exhibit a strong negative linear trend (downward slope).
* **Purple Series ($\beta = 1.145$):** Shows the steepest negative slope. It starts at approximately (-19, -2.5) and terminates at approximately (-9, -14.5).
* **Orange Series ($\beta = 0.662$):** Shows an intermediate negative slope. It starts at approximately (-19, -4) and terminates at approximately (-2, -15.5).
* **Green Series ($\beta = 0.362$):** Shows the shallowest negative slope. It starts at approximately (-19, -5) and terminates at approximately (8, -14.5).
#### Plot (b): ACF vs. lag
All three series exhibit an exponential-like decay starting from (0, 1.0).
* **Purple Series ($\beta = 1.145$):** Exhibits the slowest decay rate. At lag 30, the ACF value is approximately 0.3.
* **Orange Series ($\beta = 0.662$):** Exhibits an intermediate decay rate. At lag 30, the ACF value is approximately 0.1.
* **Green Series ($\beta = 0.362$):** Exhibits the fastest decay rate. At lag 30, the ACF value is approximately 0.05.
---
### Key Observations
* **Inverse Correlation:** There is a clear inverse relationship between the $\beta$ value and the rate of decay in the ACF plot. A higher $\beta$ (Purple) results in slower decay (higher persistence/memory), while a lower $\beta$ (Green) results in faster decay.
* **Slope Sensitivity:** In the log(p) vs. Energy plot, higher $\beta$ values correspond to steeper negative slopes.
* **High Linearity:** The $R^2$ values in plot (a) (0.99, 0.977, 0.99) confirm that the linear fit for these energy distributions is extremely high across all three parameters.
---
### Interpretation
This data likely represents the analysis of a stochastic process or a physical system (such as a time series or a particle distribution) where $\beta$ acts as a scaling exponent or a parameter governing the system's "memory" or "persistence."
* **Reading between the lines:** The Purple series ($\beta = 1.145$) demonstrates "long-range correlation" or "long memory," as evidenced by the ACF remaining significantly above zero even at high lag values. Conversely, the Green series ($\beta = 0.362$) behaves more like a system with short-range correlation, losing its autocorrelation rapidly.
* **System Behavior:** The plots suggest that as the parameter $\beta$ increases, the system becomes more ordered or persistent (slower decay in ACF) and exhibits a more concentrated energy distribution (steeper slope in log(p)). This is a classic signature of systems undergoing phase transitions or exhibiting critical behavior, where the scaling exponent $\beta$ dictates the structural properties of the data.