## Line Graphs: Accuracy vs. Parameter c for Different K and r Values
### Overview
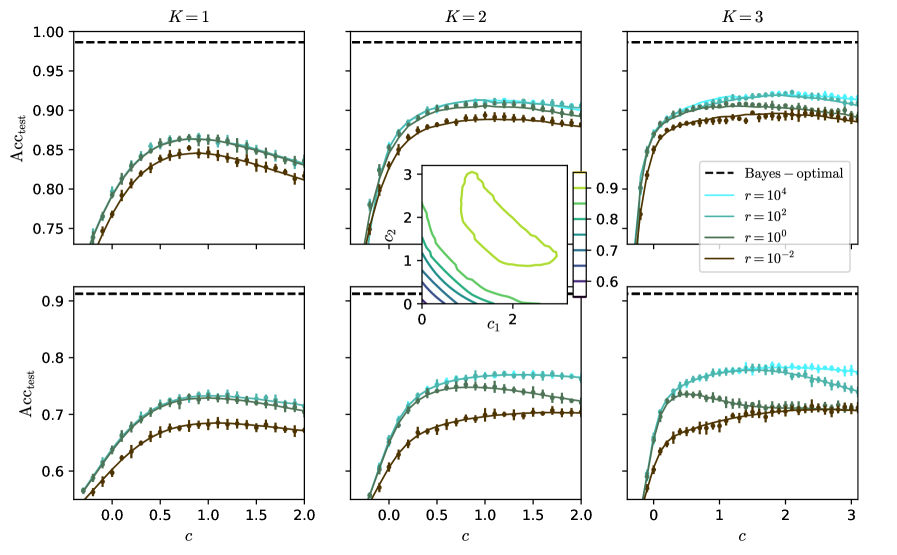
The image contains six line graphs arranged in a 2x3 grid, each representing test accuracy (Acc_test) as a function of parameter c for different values of K (1, 2, 3) and r (10⁻², 10⁰, 10², 10⁴). A dashed "Bayes-optimal" reference line is present in all graphs. An inset contour plot in the center shows relationships between parameters c₁ and c₂.
### Components/Axes
- **X-axis**: Parameter c (ranges 0–2 or 0–3 depending on K)
- **Y-axis**: Test accuracy (Acc_test) from 0.6 to 1.0
- **Legend**: Located in top-right corner of main charts, with colors:
- Cyan: r = 10⁴
- Teal: r = 10²
- Olive: r = 10⁰
- Brown: r = 10⁻²
- Dashed black: Bayes-optimal
- **Inset**: Contour plot labeled "c₁ vs. c₂" with color-coded regions (yellow to purple)
### Detailed Analysis
#### K=1 (Top-left)
- **Trend**: All r values show sigmoidal growth toward Bayes-optimal (dashed line).
- **Data points**:
- r=10⁴: Peaks at ~0.85 Acc_test at c=1.5
- r=10²: Peaks at ~0.83 Acc_test at c=1.2
- r=10⁰: Peaks at ~0.80 Acc_test at c=1.0
- r=10⁻²: Peaks at ~0.75 Acc_test at c=0.8
#### K=2 (Top-middle)
- **Trend**: Faster convergence to Bayes-optimal than K=1.
- **Data points**:
- r=10⁴: Reaches ~0.92 Acc_test at c=1.8
- r=10²: Reaches ~0.90 Acc_test at c=1.5
- r=10⁰: Reaches ~0.87 Acc_test at c=1.2
- r=10⁻²: Reaches ~0.82 Acc_test at c=1.0
#### K=3 (Top-right)
- **Trend**: Nearest to Bayes-optimal across all c.
- **Data points**:
- r=10⁴: Maintains ~0.98 Acc_test from c=1.0 onward
- r=10²: Peaks at ~0.95 Acc_test at c=2.0
- r=10⁰: Peaks at ~0.93 Acc_test at c=1.8
- r=10⁻²: Peaks at ~0.89 Acc_test at c=1.5
#### K=1 (Bottom-left)
- **Trend**: Similar to top-left but lower baseline.
- **Data points**:
- r=10⁴: Peaks at ~0.78 Acc_test at c=1.5
- r=10²: Peaks at ~0.76 Acc_test at c=1.2
- r=10⁰: Peaks at ~0.73 Acc_test at c=1.0
- r=10⁻²: Peaks at ~0.68 Acc_test at c=0.8
#### K=2 (Bottom-middle)
- **Trend**: Improved over K=1 but less than top-middle.
- **Data points**:
- r=10⁴: Reaches ~0.88 Acc_test at c=1.8
- r=10²: Reaches ~0.86 Acc_test at c=1.5
- r=10⁰: Reaches ~0.83 Acc_test at c=1.2
- r=10⁻²: Reaches ~0.78 Acc_test at c=1.0
#### K=3 (Bottom-right)
- **Trend**: Slightly lower than top-right but still near-optimal.
- **Data points**:
- r=10⁴: Maintains ~0.95 Acc_test from c=1.0 onward
- r=10²: Peaks at ~0.92 Acc_test at c=2.0
- r=10⁰: Peaks at ~0.90 Acc_test at c=1.8
- r=10⁻²: Peaks at ~0.86 Acc_test at c=1.5
### Key Observations
1. **K Dependency**: Higher K values consistently show better convergence toward Bayes-optimal performance.
2. **r Dependency**: Larger r values (10⁴, 10²) outperform smaller r values (10⁰, 10⁻²) across all K.
3. **Inset Contour**: The yellow-to-purple gradient suggests optimal regions for c₁ and c₂, with yellow likely representing highest performance.
4. **Asymptotic Behavior**: All curves approach but never exceed the Bayes-optimal line, indicating theoretical limits.
### Interpretation
The data demonstrates that increasing K improves model performance by better capturing underlying patterns, while larger r values (potentially representing sample size or regularization strength) enhance accuracy. The contour plot implies that optimal parameter combinations (c₁, c₂) exist in specific regions, with yellow areas likely corresponding to highest performance. The consistent gap between observed accuracy and Bayes-optimal suggests inherent model limitations or data complexity. Notably, the bottom-row graphs (possibly validation/test sets) show lower performance than top-row training graphs, indicating potential overfitting for smaller r values.