## Diagram: Hallucination Detection Pipeline
### Overview
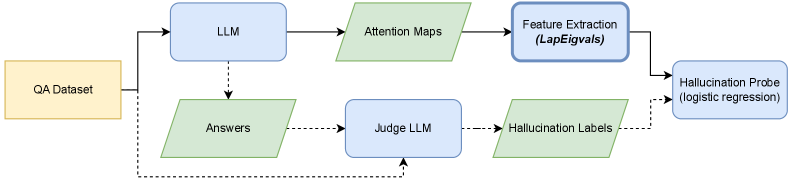
The image is a flowchart illustrating a pipeline for detecting hallucinations in a Large Language Model (LLM). It shows the flow of data and processes from a QA Dataset to a Hallucination Probe.
### Components/Axes
* **Shapes:** The diagram uses rectangles and parallelograms to represent different stages or components. Rectangles with rounded corners are used for processes, while parallelograms are used for data.
* **Colors:** The diagram uses three colors: yellow, blue, and green. Yellow is used for the initial dataset, blue for LLM-related components, and green for intermediate data or labels.
* **Lines:** Solid lines indicate the primary flow of data, while dashed lines indicate secondary or feedback paths.
* **Text Labels:** Each shape is labeled with a descriptive name.
### Detailed Analysis
1. **QA Dataset:** A yellow rectangle on the left labeled "QA Dataset" serves as the starting point.
2. **LLM:** A blue rectangle labeled "LLM" is positioned to the right of the QA Dataset. A solid arrow connects the QA Dataset to the LLM.
3. **Answers:** A green parallelogram labeled "Answers" is positioned below the LLM. A dashed arrow connects the LLM to the Answers.
4. **Attention Maps:** A green parallelogram labeled "Attention Maps" is positioned to the right of the LLM. A solid arrow connects the LLM to the Attention Maps.
5. **Judge LLM:** A blue rectangle labeled "Judge LLM" is positioned to the right of the Answers. A dashed arrow connects the Answers to the Judge LLM.
6. **Hallucination Labels:** A green parallelogram labeled "Hallucination Labels" is positioned to the right of the Judge LLM. A dashed arrow connects the Judge LLM to the Hallucination Labels.
7. **Feature Extraction (LapEigvals):** A blue rectangle labeled "Feature Extraction (LapEigvals)" is positioned to the right of the Attention Maps. A solid arrow connects the Attention Maps to the Feature Extraction.
8. **Hallucination Probe (logistic regression):** A blue rectangle labeled "Hallucination Probe (logistic regression)" is positioned to the right of the Feature Extraction and above the Hallucination Labels. A solid arrow connects the Feature Extraction to the Hallucination Probe. A dashed arrow connects the Hallucination Labels to the Hallucination Probe.
9. **Feedback Loop:** A dashed arrow connects the Hallucination Labels back to the Judge LLM. A dashed arrow connects the Hallucination Labels back to the QA Dataset.
### Key Observations
* The pipeline starts with a QA Dataset and uses an LLM to generate answers and attention maps.
* Feature extraction is performed on the attention maps using LapEigvals.
* A Judge LLM evaluates the answers and generates hallucination labels.
* A Hallucination Probe, using logistic regression, combines the extracted features and hallucination labels to detect hallucinations.
* There is a feedback loop from the hallucination labels back to the Judge LLM and the QA Dataset.
### Interpretation
The diagram illustrates a method for detecting hallucinations in LLMs. The process involves generating answers and attention maps, extracting features from the attention maps, and using a Judge LLM to provide hallucination labels. These elements are then combined in a Hallucination Probe to identify instances of hallucination. The feedback loop suggests an iterative process where the hallucination labels are used to refine the Judge LLM and potentially improve the QA Dataset. The use of LapEigvals for feature extraction from attention maps indicates a focus on structural or relational aspects of the attention patterns.