\n
## Diagram: LLM Hallucination Evaluation Pipeline
### Overview
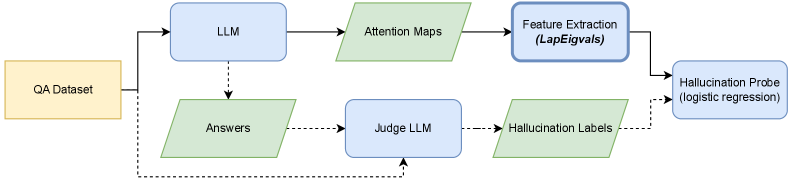
The image depicts a diagram illustrating a pipeline for evaluating hallucinations in Large Language Models (LLMs). The pipeline takes a QA Dataset as input and processes it through several stages to identify and assess instances of hallucination. The diagram shows the flow of data and the components involved in this evaluation process.
### Components/Axes
The diagram consists of the following components, represented as rounded rectangles:
* **QA Dataset:** (Yellow) - The initial input to the pipeline.
* **LLM:** (Blue) - The Large Language Model being evaluated.
* **Attention Maps:** (Light Green) - Output from the LLM, representing attention weights.
* **Feature Extraction (LapEigvals):** (Blue) - A process for extracting features from the attention maps.
* **Hallucination Probe (logistic regression):** (Blue) - A model used to detect hallucinations based on extracted features.
* **Answers:** (Light Green) - Output from the LLM, representing the generated answers.
* **Judge LLM:** (Blue) - An LLM used to judge the correctness of the answers.
* **Hallucination Labels:** (Light Green) - Labels assigned by the Judge LLM indicating the presence or absence of hallucinations.
Arrows indicate the flow of data between these components. A dashed line connects the QA Dataset directly to the Judge LLM, indicating a separate input path.
### Detailed Analysis or Content Details
The pipeline operates as follows:
1. A **QA Dataset** is fed into the **LLM**.
2. The **LLM** generates **Answers** and produces **Attention Maps**.
3. The **Attention Maps** are processed by **Feature Extraction (LapEigvals)**.
4. The extracted features are used by the **Hallucination Probe (logistic regression)** to identify potential hallucinations.
5. The **Answers** are evaluated by a **Judge LLM**, which assigns **Hallucination Labels**.
6. The **Hallucination Labels** are then used to assess the performance of the LLM.
7. The **QA Dataset** is also directly input into the **Judge LLM** for comparison.
The diagram does not contain numerical data or specific values. It is a visual representation of a process.
### Key Observations
The diagram highlights a multi-faceted approach to hallucination detection, combining attention map analysis with a judgment process using another LLM. The use of a "Hallucination Probe" suggests a quantitative method for identifying hallucinations based on extracted features. The direct input of the QA Dataset to the Judge LLM implies a comparison between the LLM's answers and the ground truth.
### Interpretation
This diagram illustrates a sophisticated pipeline for evaluating the tendency of LLMs to "hallucinate" – generate outputs that are not grounded in the input data or factual knowledge. The pipeline attempts to address this issue by:
* **Analyzing Attention:** Examining where the LLM is focusing its attention during answer generation.
* **Quantitative Detection:** Using a machine learning model (logistic regression) to identify patterns in attention maps that correlate with hallucinations.
* **Human-in-the-Loop Evaluation:** Employing another LLM as a "judge" to assess the correctness of the generated answers.
The inclusion of both attention map analysis and a judge LLM suggests a desire to combine the strengths of both approaches – the ability to identify subtle patterns in the LLM's internal state (attention maps) with the ability to assess the overall quality and factual accuracy of the generated output (judge LLM). The dashed line from the QA Dataset to the Judge LLM indicates that the Judge LLM has access to the original question and answer pairs, allowing it to determine if the LLM's response is consistent with the provided information. This pipeline is designed to provide a comprehensive and reliable method for evaluating and mitigating hallucinations in LLMs.