## Diagram: LLM Hallucination Detection Pipeline
### Overview
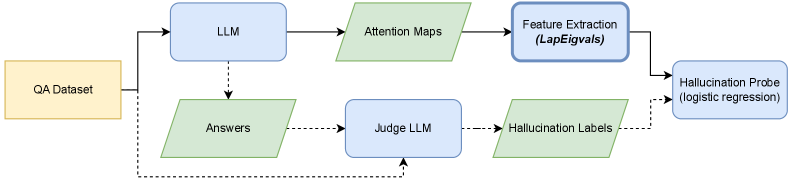
The image displays a technical flowchart illustrating a machine learning pipeline designed to detect hallucinations in Large Language Model (LLM) outputs. The process begins with a Question-Answering (QA) dataset and branches into two parallel processing paths that converge at a final classification probe. The diagram uses color-coded shapes to differentiate between data stores (yellow rectangle), processes/models (blue rectangles), and data artifacts (green parallelograms).
### Components/Axes
The diagram is composed of the following labeled components, connected by directional arrows indicating data flow:
1. **QA Dataset** (Yellow Rectangle, far left): The starting input data source.
2. **LLM** (Blue Rectangle, top-left): A Large Language Model.
3. **Attention Maps** (Green Parallelogram, top-center): Output data from the LLM.
4. **Feature Extraction (LapEigvals)** (Blue Rectangle, top-right): A processing step that extracts features, specifically using Laplacian Eigenvalues.
5. **Answers** (Green Parallelogram, bottom-left): Output data from the LLM.
6. **Judge LLM** (Blue Rectangle, bottom-center): A separate LLM used for evaluation.
7. **Hallucination Labels** (Green Parallelogram, bottom-right): Output labels from the Judge LLM.
8. **Hallucination Probe (logistic regression)** (Blue Rectangle, far right): The final classifier model.
**Flow Connections (Solid Arrows):**
* `QA Dataset` → `LLM`
* `LLM` → `Attention Maps`
* `Attention Maps` → `Feature Extraction (LapEigvals)`
* `Feature Extraction (LapEigvals)` → `Hallucination Probe (logistic regression)`
* `LLM` → `Answers`
* `Answers` → `Judge LLM`
* `Judge LLM` → `Hallucination Labels`
* `Hallucination Labels` → `Hallucination Probe (logistic regression)`
**Flow Connections (Dashed Arrows):**
* `QA Dataset` → `Judge LLM` (A secondary, direct data path)
* `Hallucination Labels` → `Hallucination Probe (logistic regression)` (A secondary connection, possibly indicating label usage in training)
### Detailed Analysis
The pipeline operates through two distinct, parallel pathways that originate from the same `QA Dataset`:
**Path 1 (Top - Feature-Based):**
1. The `QA Dataset` is fed into a primary `LLM`.
2. The `LLM` generates `Attention Maps` as an internal representation.
3. These maps undergo `Feature Extraction` using Laplacian Eigenvalues (`LapEigvals`), a technique often used in spectral clustering and dimensionality reduction to identify structural features.
4. The extracted features are sent to the `Hallucination Probe`.
**Path 2 (Bottom - Label-Based):**
1. The same `QA Dataset` is also used by the primary `LLM` to generate `Answers`.
2. These `Answers` are evaluated by a separate `Judge LLM`.
3. The `Judge LLM` produces `Hallucination Labels` (likely binary: hallucinated/factual).
4. These labels are sent to the `Hallucination Probe`.
**Convergence:**
Both the engineered features (from Path 1) and the supervision labels (from Path 2) converge at the `Hallucination Probe (logistic regression)`. This suggests the probe is a logistic regression model trained to predict hallucinations using the extracted Laplacian Eigenvalue features, with the labels from the Judge LLM serving as the ground truth for training.
### Key Observations
1. **Dual-Path Architecture:** The system uses a hybrid approach, combining low-level model internals (`Attention Maps` → `Features`) with high-level semantic evaluation (`Answers` → `Judge LLM` → `Labels`).
2. **Specialized Components:** The pipeline distinguishes between the generative `LLM` and the evaluative `Judge LLM`, indicating a modular design where judgment is offloaded to a separate model.
3. **Feature Engineering:** The specific mention of `LapEigvals` indicates a deliberate choice to use spectral graph theory features derived from attention maps, hypothesizing that the structure of attention correlates with factual reliability.
4. **Final Classifier:** The use of `logistic regression` for the final probe suggests an emphasis on an interpretable, linear model for the detection task, possibly to understand which extracted features are most predictive.
### Interpretation
This diagram outlines a research or engineering methodology for **detecting hallucinations in LLMs by analyzing their internal attention mechanisms**. The core hypothesis is that the patterns in a model's attention (captured via maps and transformed into Laplacian Eigenvalues) contain signal about whether the generated answer is factual or a hallucination.
The pipeline is investigative in nature. It doesn't just use a judge to label answers; it seeks an *automated, feature-based proxy* for hallucination by training a probe on those labels. The `Hallucination Probe` is the key output—a model that, once trained, could potentially flag hallucinations in new LLM outputs by analyzing attention maps alone, without needing a (computationally expensive) Judge LLM for every new answer.
The dashed line from `QA Dataset` to `Judge LLM` is crucial. It implies the Judge LLM receives the original question context, not just the answer, enabling more accurate judgment. The overall structure suggests a move towards **explainable AI for LLM safety**, attempting to ground the abstract concept of "hallucination" in measurable, internal model features.