## Line Chart: Surprisal vs. Training Steps
### Overview
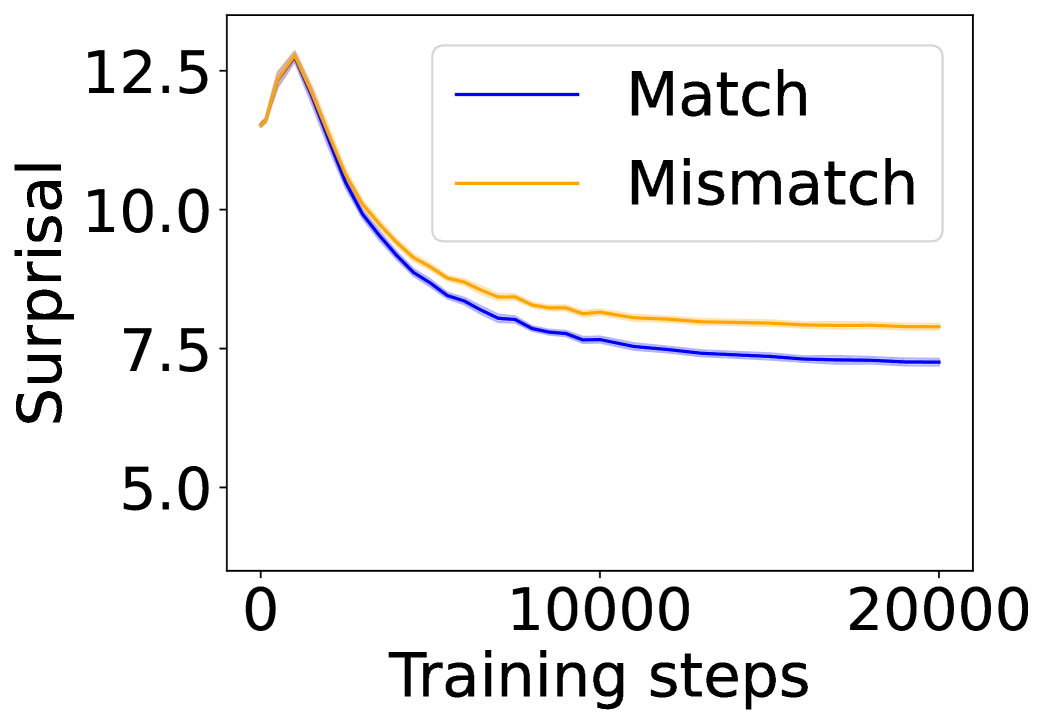
The image is a line chart that plots "Surprisal" on the y-axis against "Training steps" on the x-axis. Two data series are displayed: "Match" (blue line) and "Mismatch" (orange line). Both lines initially peak and then decrease, eventually leveling off. The chart includes a legend in the top-right corner. Shaded regions around each line likely represent confidence intervals or standard deviations.
### Components/Axes
* **X-axis:** "Training steps" ranging from 0 to 20000, with a major tick at 10000.
* **Y-axis:** "Surprisal" ranging from 5.0 to 12.5, with major ticks at 5.0, 7.5, 10.0, and 12.5.
* **Legend:** Located in the top-right corner, it identifies the two data series:
* "Match" - represented by a blue line.
* "Mismatch" - represented by an orange line.
### Detailed Analysis
* **Match (Blue Line):**
* Trend: Initially increases sharply, then decreases rapidly, and finally levels off.
* Data Points:
* Starts at approximately 11.5 surprisal at 0 training steps.
* Peaks at approximately 12.3 surprisal around 500 training steps.
* Decreases to approximately 7.5 surprisal at 10000 training steps.
* Levels off at approximately 7.2 surprisal at 20000 training steps.
* **Mismatch (Orange Line):**
* Trend: Initially increases sharply, then decreases rapidly, and finally levels off.
* Data Points:
* Starts at approximately 12.0 surprisal at 0 training steps.
* Peaks at approximately 12.7 surprisal around 500 training steps.
* Decreases to approximately 8.3 surprisal at 10000 training steps.
* Levels off at approximately 7.8 surprisal at 20000 training steps.
### Key Observations
* Both "Match" and "Mismatch" series exhibit a similar trend: a sharp initial increase followed by a rapid decrease and then a leveling off.
* The "Mismatch" series consistently shows a higher surprisal value than the "Match" series across all training steps.
* The shaded regions around the lines suggest some variability in the data, but the overall trends are clear.
* The most significant change in surprisal occurs within the first 5000 training steps.
### Interpretation
The chart illustrates how surprisal changes with training steps for "Match" and "Mismatch" conditions. The initial increase in surprisal likely reflects the model's initial uncertainty or difficulty in processing the input. As the model trains, surprisal decreases, indicating that the model is becoming more proficient at predicting or understanding the data. The fact that "Mismatch" consistently has a higher surprisal suggests that the model finds "Mismatch" conditions more surprising or difficult to process than "Match" conditions. The leveling off of both lines indicates that the model has reached a point of diminishing returns in terms of learning, and further training may not significantly reduce surprisal.