## Line Chart: Surprisal vs. Training Steps
### Overview
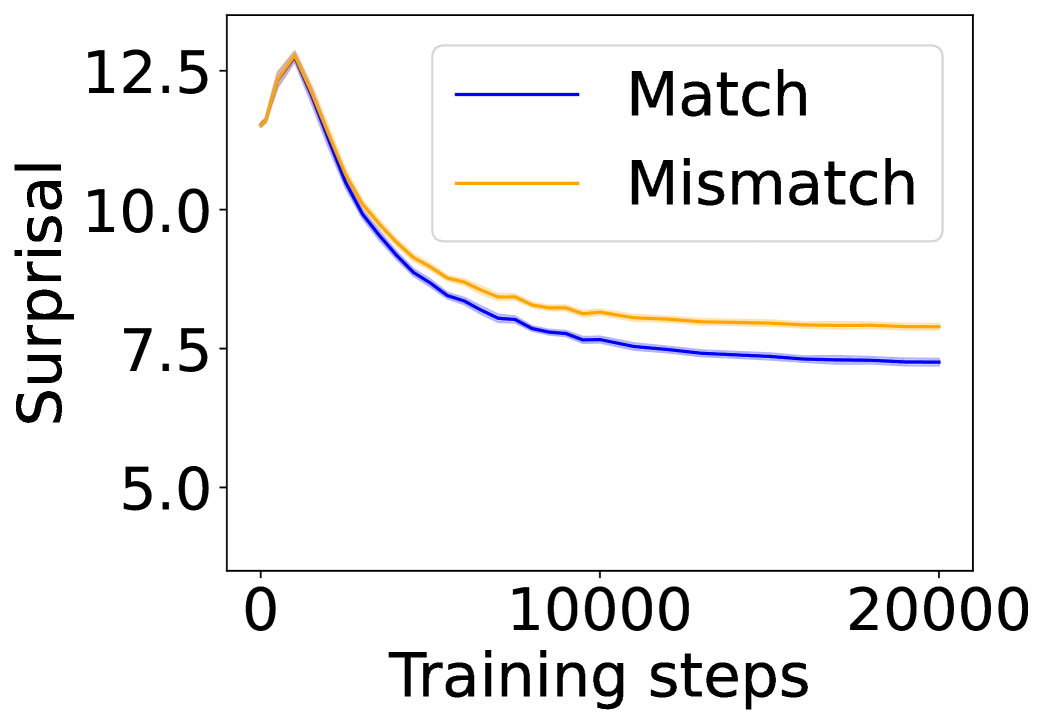
The image displays a line chart plotting "Surprisal" against "Training steps" for two conditions: "Match" and "Mismatch." The chart illustrates how the surprisal metric changes over the course of a training process, with both conditions showing a decreasing trend that plateaus.
### Components/Axes
* **Chart Type:** Line chart with two data series.
* **X-Axis:**
* **Label:** "Training steps"
* **Scale:** Linear, from 0 to 20,000.
* **Major Tick Marks:** 0, 10000, 20000.
* **Y-Axis:**
* **Label:** "Surprisal"
* **Scale:** Linear, from approximately 4.5 to 13.0.
* **Major Tick Marks:** 5.0, 7.5, 10.0, 12.5.
* **Legend:**
* **Position:** Top-right quadrant of the chart area.
* **Items:**
1. **Match:** Represented by a solid blue line.
2. **Mismatch:** Represented by a solid orange line.
* **Language:** All text in the chart is in English.
### Detailed Analysis
**Data Series Trends:**
1. **Match (Blue Line):**
* **Trend:** Starts at a high value, experiences a steep, near-linear decline for the first ~5,000 steps, then the rate of decrease slows, forming a convex curve that asymptotically approaches a plateau.
* **Approximate Data Points:**
* Step 0: ~12.5
* Step 5,000: ~9.0
* Step 10,000: ~7.7
* Step 15,000: ~7.4
* Step 20,000: ~7.3
2. **Mismatch (Orange Line):**
* **Trend:** Follows a very similar shape to the Match line—a steep initial decline followed by a plateau. It remains consistently above the Match line after the initial point.
* **Approximate Data Points:**
* Step 0: ~12.5 (nearly identical to Match)
* Step 5,000: ~9.5
* Step 10,000: ~8.2
* Step 15,000: ~8.0
* Step 20,000: ~7.9
**Relationship Between Series:**
* Both lines originate from approximately the same point (~12.5 at step 0).
* A gap opens immediately, with the Mismatch (orange) line maintaining a higher surprisal value than the Match (blue) line throughout the entire training process.
* The vertical gap between the two lines appears relatively constant after the initial divergence, approximately 0.5 - 0.7 units of surprisal.
### Key Observations
1. **Convergent Learning:** Both conditions demonstrate learning, as evidenced by the significant decrease in surprisal over training steps.
2. **Performance Gap:** The "Match" condition consistently achieves lower surprisal than the "Mismatch" condition, indicating better performance or predictability.
3. **Plateau Behavior:** Both curves show diminishing returns, with the most dramatic improvements occurring in the first quarter of the displayed training steps (0-5,000). The rate of improvement becomes marginal after step 10,000.
4. **Initial Similarity:** At the very start of training (step 0), the surprisal values for both conditions are virtually indistinguishable.
### Interpretation
This chart likely visualizes the performance of a machine learning model during training, where "surprisal" is a loss or error metric (lower is better). The "Match" and "Mismatch" conditions probably refer to different experimental setups, such as training on in-distribution vs. out-of-distribution data, or with aligned vs. misaligned objectives.
The data suggests that while the model learns effectively in both scenarios (surprisal drops), it learns *better* or achieves a more optimal state under the "Match" condition. The persistent gap indicates a fundamental difference in the difficulty or learnability of the two tasks. The plateau implies that after a certain point (~10,000 steps), additional training yields minimal further reduction in surprisal for this specific setup, suggesting the model has approached its capacity limit for the given data and conditions. The near-identical starting point confirms that the initial state of the model is the same for both experiments, making the subsequent divergence a direct result of the differing conditions.