\n
## Diagram: Causal Fairness Levels
### Overview
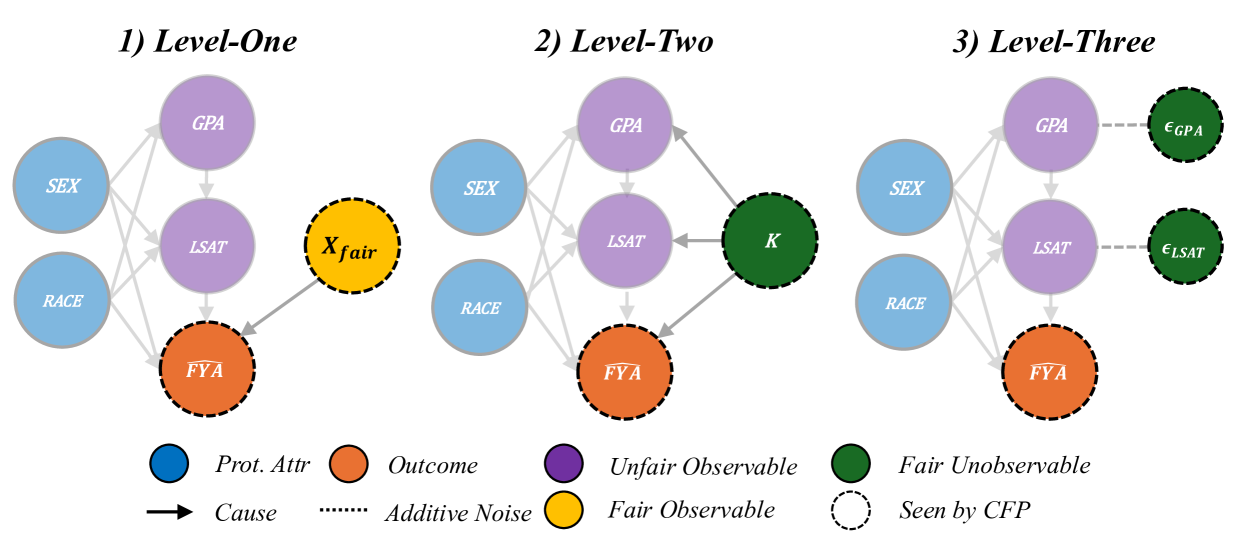
The image presents a diagram illustrating three levels of causal fairness, labeled Level-One, Level-Two, and Level-Three. Each level depicts a causal model with nodes representing variables and arrows indicating causal relationships. The diagram uses color-coding to distinguish between protected attributes, outcomes, observable and unobservable variables, and noise. The diagram aims to demonstrate how fairness can be achieved through different levels of intervention in a causal model.
### Components/Axes
The diagram consists of three panels, arranged horizontally. Each panel represents a different level of fairness. The key components are:
* **Nodes:** Represent variables such as SEX, RACE, GPA, LSAT, FYA, Xfair, and K. Nodes are color-coded as follows:
* Blue: Protected Attribute (Prot. Attr.)
* Orange: Outcome
* Purple: Unfair Observable
* Black: Unfair Unobservable
* Green: Fair Unobservable
* White: Seen by CFP (Counterfactual Fairness Policy)
* **Arrows:** Represent causal relationships (Cause). Solid arrows indicate direct causal effects.
* **Dotted Arrows:** Represent additive noise.
* **Legend:** Located at the bottom of the image, explaining the color-coding and symbols used in the diagram.
* **Level Labels:** "1) Level-One", "2) Level-Two", "3) Level-Three" are positioned above each panel.
### Detailed Analysis or Content Details
**Level-One:**
* Variables: SEX (blue), RACE (blue), GPA (purple), LSAT (purple), FYA (orange).
* Causal relationships:
* SEX -> GPA
* SEX -> LSAT
* RACE -> GPA
* RACE -> LSAT
* GPA -> FYA
* LSAT -> FYA
* Additive Noise: Dotted lines connect to GPA, LSAT, and FYA.
**Level-Two:**
* Variables: SEX (blue), RACE (blue), GPA (purple), LSAT (purple), FYA (orange), Xfair (orange).
* Causal relationships:
* SEX -> GPA
* SEX -> LSAT
* RACE -> GPA
* RACE -> LSAT
* GPA -> FYA
* LSAT -> FYA
* Xfair -> FYA
* Unfair Unobservable: K (black) influences LSAT.
* Additive Noise: Dotted lines connect to FYA.
**Level-Three:**
* Variables: SEX (blue), RACE (blue), GPA (purple), LSAT (purple), FYA (orange), εGPA (green), εLSAT (green).
* Causal relationships:
* SEX -> GPA
* SEX -> LSAT
* RACE -> GPA
* RACE -> LSAT
* GPA -> FYA
* LSAT -> FYA
* Fair Unobservable: εGPA influences GPA, εLSAT influences LSAT.
* Additive Noise: Dotted lines connect to GPA, LSAT, and FYA.
### Key Observations
* The complexity of the causal model increases from Level-One to Level-Three.
* Level-Two introduces an unobservable variable (K) that influences LSAT, representing a source of unfairness.
* Level-Three introduces fair unobservable variables (εGPA, εLSAT) that influence GPA and LSAT, respectively, suggesting a mechanism for achieving fairness.
* The outcome variable (FYA) is directly influenced by multiple variables in each level.
* The diagram illustrates a progression from a model with direct causal effects of protected attributes to a model where fairness is achieved through interventions on unobservable variables.
### Interpretation
The diagram demonstrates a hierarchical approach to achieving causal fairness. Level-One represents a naive model where protected attributes (SEX, RACE) directly influence the outcome (FYA) through observable variables (GPA, LSAT). Level-Two introduces the concept of unobserved confounding (K), highlighting a source of unfairness that is not captured by simply controlling for observable variables. Level-Three proposes a solution by introducing fair unobservable variables (εGPA, εLSAT) that can be intervened upon to mitigate the effects of unfairness.
The diagram suggests that achieving fairness requires a deeper understanding of the underlying causal mechanisms and the ability to intervene on unobservable variables. The CFP (Counterfactual Fairness Policy) is indicated as being able to "see" the white nodes, implying that it can leverage information about these variables to make fairer decisions. The progression from Level-One to Level-Three represents a shift from simply observing correlations to understanding and addressing the root causes of unfairness. The use of color-coding and symbols effectively communicates the different types of variables and their roles in the causal model. The diagram is a conceptual illustration of causal fairness and does not provide specific numerical data or quantitative analysis.