## Heatmap Visualization: Target vs. Output Patterns Over Time
### Overview
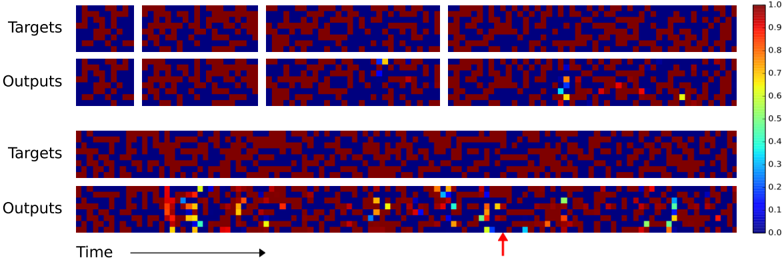
The image presents a comparative visualization of "Targets" and "Outputs" across two distinct formats: a 2x2 grid of small panels (top section) and two elongated panels (bottom section). Both sections use a color-coded heatmap to represent values, with a vertical color scale from 0.0 (blue) to 1.0 (red). A red arrow highlights a specific region in the bottom "Outputs" panel.
---
### Components/Axes
1. **Top Section (2x2 Grid)**:
- **Labels**:
- Top row: "Targets" (left) and "Outputs" (right).
- Bottom row: Repeats "Targets" and "Outputs".
- **Structure**:
- Four equal-sized panels arranged in a 2x2 grid.
- No explicit axes or numerical labels.
- **Color Scale**:
- Vertical legend on the right (0.0–1.0), with red (1.0) at the top and blue (0.0) at the bottom.
2. **Bottom Section (Long Panels)**:
- **Labels**:
- Top row: "Targets" (left) and "Outputs" (right).
- Bottom row: Repeats "Targets" and "Outputs".
- **Axes**:
- Horizontal axis labeled "Time" with an arrow pointing right.
- No explicit y-axis label.
- **Color Scale**:
- Same vertical legend as the top section.
---
### Detailed Analysis
1. **Top Section**:
- **Targets Panels**:
- Dominated by red (high values) and blue (low values) squares.
- Minimal yellow/green/cyan squares (values ~0.6–0.8).
- **Outputs Panels**:
- Similar red/blue distribution but with scattered yellow, green, and cyan squares (values ~0.3–0.7).
- Notable: A single yellow square in the top-right "Outputs" panel.
2. **Bottom Section**:
- **Targets Panel**:
- Long horizontal strip with dense red/blue patterns.
- No colored squares beyond red/blue.
- **Outputs Panel**:
- Scattered colored squares (yellow, green, cyan) distributed across the panel.
- Red arrow points to a cluster of yellow/green squares near the right edge.
- Values range from 0.1 (cyan) to 0.9 (red).
---
### Key Observations
1. **Color Distribution**:
- Outputs consistently show more colored squares (yellow/green/cyan) than targets, suggesting dynamic changes or activations.
- The red arrow highlights a localized region of heightened activity in the bottom "Outputs" panel.
2. **Temporal Progression**:
- The "Time" axis implies outputs evolve over time, with the arrow marking a specific temporal point of interest.
3. **Value Ranges**:
- Targets: Primarily high (red) and low (blue) values.
- Outputs: Broader range, including intermediate values (yellow/green/cyan).
---
### Interpretation
1. **Model Performance**:
- The outputs likely represent a model's predictions or activations compared to static target patterns.
- The presence of colored squares in outputs (vs. targets) suggests the model identifies or generates features not explicitly present in the targets.
2. **Anomaly Detection**:
- The red arrow points to a region where the model's output exhibits concentrated activity (yellow/green), potentially indicating a focus on specific temporal or spatial features.
3. **Color Scale Consistency**:
- All panels use the same scale, confirming that red represents the highest intensity (1.0) and blue the lowest (0.0). Intermediate colors (yellow, green, cyan) correspond to mid-range values (~0.3–0.8).
4. **Structural Differences**:
- The top section emphasizes localized patterns (2x2 grid), while the bottom section highlights temporal evolution (long panels with time axis).
---
### Conclusion
The visualization demonstrates how outputs diverge from targets over time, with colored squares in outputs reflecting dynamic changes or model-generated features. The red arrow underscores a critical region where the model's activity peaks, suggesting potential insights into its decision-making process or error patterns.