## Line Chart: Accuracy vs. Sampled Reasoning Paths
### Overview
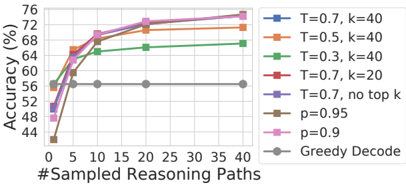
This image presents a line chart illustrating the relationship between the number of sampled reasoning paths and the resulting accuracy, for various decoding strategies. The chart compares several configurations of temperature (T) and top-k sampling (k), along with probability (p) values, against a "Greedy Decode" baseline.
### Components/Axes
* **X-axis:** "#Sampled Reasoning Paths" - Ranging from 0 to 40, with markers at 0, 5, 10, 15, 20, 25, 30, 35, and 40.
* **Y-axis:** "Accuracy (%)" - Ranging from 44% to 76%, with markers at 44, 48, 52, 56, 60, 64, 68, 72, and 76.
* **Legend:** Located in the top-right corner, containing the following lines and their corresponding colors:
* T=0.7, k=40 (Blue)
* T=0.5, k=40 (Orange)
* T=0.3, k=40 (Green)
* T=0.7, k=20 (Red)
* T=0.7, no top k (Dark Blue)
* p=0.95 (Brown)
* p=0.9 (Magenta)
* Greedy Decode (Gray)
### Detailed Analysis
Here's a breakdown of each line's trend and approximate data points:
* **T=0.7, k=40 (Blue):** The line slopes upward, showing increasing accuracy with more sampled reasoning paths.
* 0 Paths: ~54%
* 5 Paths: ~60%
* 10 Paths: ~67%
* 15 Paths: ~70%
* 20 Paths: ~72%
* 25 Paths: ~73%
* 30 Paths: ~73.5%
* 35 Paths: ~74%
* 40 Paths: ~75%
* **T=0.5, k=40 (Orange):** The line also slopes upward, but starts lower and plateaus earlier than the blue line.
* 0 Paths: ~44%
* 5 Paths: ~54%
* 10 Paths: ~65%
* 15 Paths: ~69%
* 20 Paths: ~71%
* 25 Paths: ~72%
* 30 Paths: ~72%
* 35 Paths: ~72%
* 40 Paths: ~72%
* **T=0.3, k=40 (Green):** This line shows a moderate upward slope, but remains lower than the blue and orange lines.
* 0 Paths: ~50%
* 5 Paths: ~58%
* 10 Paths: ~64%
* 15 Paths: ~66%
* 20 Paths: ~68%
* 25 Paths: ~68%
* 30 Paths: ~68%
* 35 Paths: ~68%
* 40 Paths: ~68%
* **T=0.7, k=20 (Red):** This line exhibits a similar upward trend to the blue line, but with slightly lower accuracy values.
* 0 Paths: ~54%
* 5 Paths: ~62%
* 10 Paths: ~68%
* 15 Paths: ~70%
* 20 Paths: ~71%
* 25 Paths: ~72%
* 30 Paths: ~72%
* 35 Paths: ~73%
* 40 Paths: ~73%
* **T=0.7, no top k (Dark Blue):** This line shows a strong upward trend, reaching the highest accuracy values.
* 0 Paths: ~56%
* 5 Paths: ~64%
* 10 Paths: ~71%
* 15 Paths: ~73%
* 20 Paths: ~74%
* 25 Paths: ~75%
* 30 Paths: ~75%
* 35 Paths: ~75%
* 40 Paths: ~76%
* **p=0.95 (Brown):** This line shows a moderate upward trend, similar to the green line.
* 0 Paths: ~54%
* 5 Paths: ~60%
* 10 Paths: ~66%
* 15 Paths: ~69%
* 20 Paths: ~70%
* 25 Paths: ~71%
* 30 Paths: ~71%
* 35 Paths: ~71%
* 40 Paths: ~72%
* **p=0.9 (Magenta):** This line exhibits the strongest upward trend and achieves the highest accuracy values, closely following the "T=0.7, no top k" line.
* 0 Paths: ~54%
* 5 Paths: ~62%
* 10 Paths: ~70%
* 15 Paths: ~72%
* 20 Paths: ~73%
* 25 Paths: ~74%
* 30 Paths: ~74%
* 35 Paths: ~75%
* 40 Paths: ~75%
* **Greedy Decode (Gray):** This line remains flat at approximately 56% accuracy, regardless of the number of sampled reasoning paths.
* All Paths: ~56%
### Key Observations
* Increasing the number of sampled reasoning paths generally improves accuracy for most decoding strategies.
* The "Greedy Decode" strategy consistently performs the worst and does not benefit from increased sampling.
* The "T=0.7, no top k" and "p=0.9" strategies achieve the highest accuracy, particularly with a larger number of sampled reasoning paths.
* Lower temperature values (T=0.3) result in lower accuracy compared to higher temperature values (T=0.5, T=0.7).
* Reducing the top-k value (k=20 vs k=40) appears to slightly decrease accuracy.
### Interpretation
The data suggests that employing sampling techniques during decoding significantly enhances the accuracy of the model, especially when combined with appropriate temperature and probability settings. The "Greedy Decode" approach, which lacks sampling, demonstrates a clear performance limitation. The superior performance of the "T=0.7, no top k" and "p=0.9" strategies indicates that removing constraints on the sampling process (no top k) or using a higher probability threshold (p=0.9) allows the model to explore a wider range of reasoning paths, leading to more accurate results. The plateauing of some lines (e.g., T=0.5, k=40) suggests diminishing returns from increasing the number of sampled paths beyond a certain point. This implies an optimal balance between sampling effort and accuracy gain. The differences in performance between the various temperature settings suggest that temperature plays a crucial role in controlling the exploration-exploitation trade-off during decoding.