## Bar Chart: Prediction Flip Rate Comparison for Llama-3 Models
### Overview
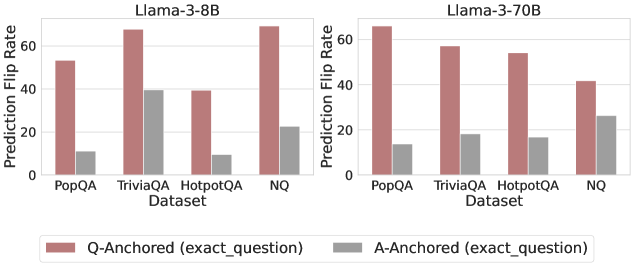
The image presents two bar charts comparing the prediction flip rates of two Llama-3 models (8B and 70B) across four different datasets: PopQA, TriviaQA, HotpotQA, and NQ. The charts compare the performance of "Q-Anchored" (exact question) and "A-Anchored" (exact question) approaches.
### Components/Axes
* **Titles:**
* Left Chart: Llama-3-8B
* Right Chart: Llama-3-70B
* **Y-Axis:** Prediction Flip Rate, with a scale from 0 to 60 in increments of 20.
* **X-Axis:** Dataset, with categories: PopQA, TriviaQA, HotpotQA, NQ.
* **Legend:** Located at the bottom of the image.
* Q-Anchored (exact\_question): Represented by a light brown color.
* A-Anchored (exact\_question): Represented by a gray color.
### Detailed Analysis
**Left Chart: Llama-3-8B**
* **PopQA:**
* Q-Anchored: Approximately 53%
* A-Anchored: Approximately 11%
* **TriviaQA:**
* Q-Anchored: Approximately 68%
* A-Anchored: Approximately 40%
* **HotpotQA:**
* Q-Anchored: Approximately 40%
* A-Anchored: Approximately 9%
* **NQ:**
* Q-Anchored: Approximately 68%
* A-Anchored: Approximately 22%
**Right Chart: Llama-3-70B**
* **PopQA:**
* Q-Anchored: Approximately 65%
* A-Anchored: Approximately 13%
* **TriviaQA:**
* Q-Anchored: Approximately 57%
* A-Anchored: Approximately 17%
* **HotpotQA:**
* Q-Anchored: Approximately 56%
* A-Anchored: Approximately 16%
* **NQ:**
* Q-Anchored: Approximately 43%
* A-Anchored: Approximately 26%
### Key Observations
* For both models, the Q-Anchored approach generally results in a higher prediction flip rate compared to the A-Anchored approach across all datasets.
* The TriviaQA dataset shows the highest prediction flip rate for the Llama-3-8B model with the Q-Anchored approach.
* The NQ dataset shows the lowest prediction flip rate for the Llama-3-70B model with the Q-Anchored approach.
* The A-Anchored approach consistently shows lower prediction flip rates across all datasets for both models.
### Interpretation
The data suggests that anchoring the question directly ("Q-Anchored") leads to a higher likelihood of prediction flips compared to anchoring the answer ("A-Anchored"). This could indicate that the models are more sensitive to variations or perturbations in the question itself. The difference in performance between the 8B and 70B models may reflect the impact of model size on robustness and stability of predictions. The specific characteristics of each dataset (PopQA, TriviaQA, HotpotQA, NQ) likely contribute to the observed variations in prediction flip rates. The higher flip rates for Q-Anchored suggest that the model's predictions are more brittle when the question is manipulated, potentially due to the model relying heavily on specific question phrasing.