## Charts: PAVs vs. ORMs & Sample Efficiency
### Overview
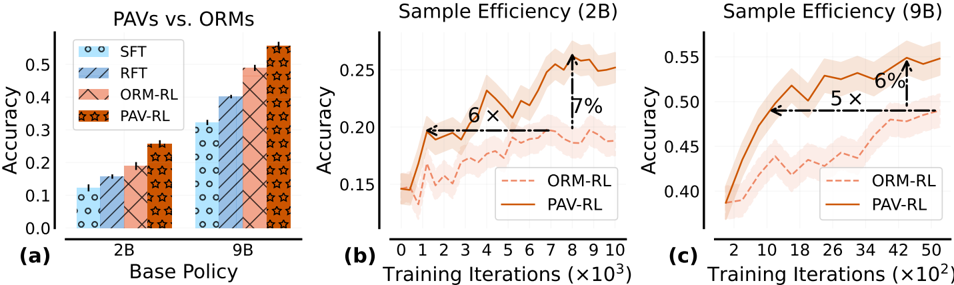
The image presents three charts comparing the performance of different reinforcement learning (RL) policies. Chart (a) compares the final accuracy of several policies (SFT, RFT, ORM-RL, and PAV-RL) across two base policy sizes (2B and 9B). Charts (b) and (c) show the sample efficiency, i.e., accuracy as a function of training iterations, for ORM-RL and PAV-RL with 2B and 9B base policies, respectively. The charts aim to demonstrate the benefits of PAV-RL in terms of both final accuracy and sample efficiency.
### Components/Axes
* **Chart (a): PAVs vs. ORMs**
* X-axis: Base Policy (2B, 9B)
* Y-axis: Accuracy (0.0 to 0.45)
* Legend:
* SFT (Supervised Fine-Tuning) - Light Blue circles
* RFT (Reinforcement Fine-Tuning) - Light Blue diagonal stripes
* ORM-RL (Offline RL) - Orange
* PAV-RL (Policy Alignment via Value) - Red stars
* **Chart (b): Sample Efficiency (2B)**
* X-axis: Training Iterations (x10^3) (0 to 9)
* Y-axis: Accuracy (0.15 to 0.3)
* Legend:
* ORM-RL - Dashed Orange line
* PAV-RL - Solid Orange line
* **Chart (c): Sample Efficiency (9B)**
* X-axis: Training Iterations (x10^2) (0 to 50)
* Y-axis: Accuracy (0.4 to 0.55)
* Legend:
* ORM-RL - Dashed Orange line
* PAV-RL - Solid Orange line
### Detailed Analysis or Content Details
* **Chart (a): PAVs vs. ORMs**
* SFT (2B): Accuracy ≈ 0.08
* SFT (9B): Accuracy ≈ 0.15
* RFT (2B): Accuracy ≈ 0.15
* RFT (9B): Accuracy ≈ 0.25
* ORM-RL (2B): Accuracy ≈ 0.25
* ORM-RL (9B): Accuracy ≈ 0.40
* PAV-RL (2B): Accuracy ≈ 0.30
* PAV-RL (9B): Accuracy ≈ 0.45
* **Chart (b): Sample Efficiency (2B)**
* ORM-RL: Starts at ≈ 0.17, increases to ≈ 0.21 by 4x10^3 iterations, then fluctuates around ≈ 0.20.
* PAV-RL: Starts at ≈ 0.16, increases rapidly to ≈ 0.26 by 8x10^3 iterations, then decreases slightly to ≈ 0.24 by 9x10^3 iterations.
* The chart indicates that PAV-RL achieves a higher accuracy than ORM-RL with 2B base policy. The text "6 x" and "7%" are placed on the chart, indicating that PAV-RL achieves 6x the accuracy and 7% improvement over ORM-RL.
* **Chart (c): Sample Efficiency (9B)**
* ORM-RL: Starts at ≈ 0.42, increases to ≈ 0.48 by 20x10^2 iterations, then fluctuates around ≈ 0.50.
* PAV-RL: Starts at ≈ 0.40, increases rapidly to ≈ 0.52 by 30x10^2 iterations, then decreases slightly to ≈ 0.48 by 50x10^2 iterations.
* The chart indicates that PAV-RL achieves a higher accuracy than ORM-RL with 9B base policy. The text "5 x" and "6%" are placed on the chart, indicating that PAV-RL achieves 5x the accuracy and 6% improvement over ORM-RL.
### Key Observations
* PAV-RL consistently outperforms ORM-RL in both final accuracy (Chart a) and sample efficiency (Charts b and c).
* Increasing the base policy size from 2B to 9B significantly improves the performance of all policies, but the relative advantage of PAV-RL remains.
* PAV-RL exhibits faster initial learning compared to ORM-RL, as evidenced by the steeper slope of the PAV-RL curves in Charts b and c.
* The accuracy of both policies fluctuates after reaching a peak, suggesting potential instability or overfitting.
### Interpretation
The data strongly suggests that PAV-RL is a more effective reinforcement learning policy than ORM-RL, particularly when using larger base policies. The higher final accuracy and faster sample efficiency of PAV-RL indicate that it can learn more effectively from limited data. The annotations "6x" and "7%" (for 2B) and "5x" and "6%" (for 9B) quantify the improvement of PAV-RL over ORM-RL, highlighting its practical significance. The fluctuations in accuracy after the initial learning phase suggest that further research is needed to improve the stability and generalization ability of both policies. The comparison of 2B and 9B base policies demonstrates the importance of model size in reinforcement learning, with larger models generally achieving better performance. The charts provide compelling evidence for the benefits of policy alignment via value (PAV-RL) as a method for improving reinforcement learning performance.