## Line Graphs: Qwen3-8B and Qwen3-32B Performance
### Overview
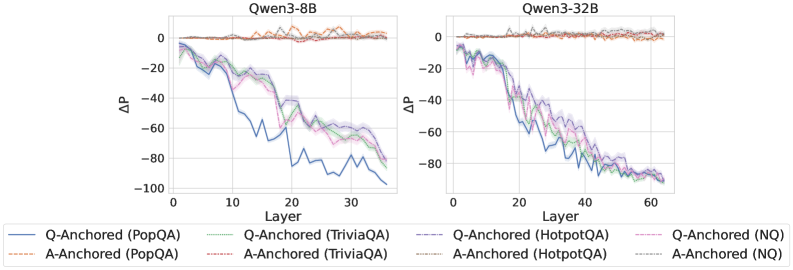
The image presents two line graphs comparing the performance of Qwen3 models (8B and 32B) across different question-answering datasets. The graphs depict the change in performance (ΔP) as a function of layer depth, with separate lines for question-anchored (Q-Anchored) and answer-anchored (A-Anchored) approaches on PopQA, TriviaQA, HotpotQA, and NQ datasets.
### Components/Axes
* **Titles:** The left graph is titled "Qwen3-8B" and the right graph is titled "Qwen3-32B".
* **Y-axis:** Both graphs share the same Y-axis label "ΔP", ranging from -100 to 0, with tick marks at -80, -60, -40, -20, and 0.
* **X-axis:** The left graph's X-axis is labeled "Layer" and ranges from 0 to 30, with tick marks every 10 units. The right graph's X-axis is labeled "Layer" and ranges from 0 to 60, with tick marks every 20 units.
* **Legend:** Located at the bottom of the image, the legend identifies the lines by color and style:
* **Blue Solid:** Q-Anchored (PopQA)
* **Brown Dashed:** A-Anchored (PopQA)
* **Green Dotted:** Q-Anchored (TriviaQA)
* **Brown Dotted-Dashed:** A-Anchored (TriviaQA)
* **Purple Dashed-Dotted:** Q-Anchored (HotpotQA)
* **Gray Dotted:** A-Anchored (HotpotQA)
* **Pink Dashed:** Q-Anchored (NQ)
* **Gray Dashed:** A-Anchored (NQ)
### Detailed Analysis
**Qwen3-8B (Left Graph):**
* **Q-Anchored (PopQA) - Blue Solid:** Starts near 0 and decreases sharply to approximately -90 by layer 30.
* **A-Anchored (PopQA) - Brown Dashed:** Remains relatively stable around 0 throughout all layers.
* **Q-Anchored (TriviaQA) - Green Dotted:** Starts near 0 and decreases to approximately -70 by layer 30.
* **A-Anchored (TriviaQA) - Brown Dotted-Dashed:** Remains relatively stable around 0 throughout all layers.
* **Q-Anchored (HotpotQA) - Purple Dashed-Dotted:** Starts near 0 and decreases to approximately -60 by layer 30.
* **A-Anchored (HotpotQA) - Gray Dotted:** Remains relatively stable around 0 throughout all layers.
* **Q-Anchored (NQ) - Pink Dashed:** Starts near 0 and decreases to approximately -60 by layer 30.
* **A-Anchored (NQ) - Gray Dashed:** Remains relatively stable around 0 throughout all layers.
**Qwen3-32B (Right Graph):**
* **Q-Anchored (PopQA) - Blue Solid:** Starts near 0 and decreases sharply to approximately -90 by layer 60.
* **A-Anchored (PopQA) - Brown Dashed:** Remains relatively stable around 0 throughout all layers.
* **Q-Anchored (TriviaQA) - Green Dotted:** Starts near 0 and decreases to approximately -80 by layer 60.
* **A-Anchored (TriviaQA) - Brown Dotted-Dashed:** Remains relatively stable around 0 throughout all layers.
* **Q-Anchored (HotpotQA) - Purple Dashed-Dotted:** Starts near 0 and decreases to approximately -80 by layer 60.
* **A-Anchored (HotpotQA) - Gray Dotted:** Remains relatively stable around 0 throughout all layers.
* **Q-Anchored (NQ) - Pink Dashed:** Starts near 0 and decreases to approximately -80 by layer 60.
* **A-Anchored (NQ) - Gray Dashed:** Remains relatively stable around 0 throughout all layers.
### Key Observations
* **Performance Drop:** Q-Anchored approaches consistently show a significant drop in performance (ΔP) as the layer depth increases for both Qwen3-8B and Qwen3-32B models.
* **A-Anchored Stability:** A-Anchored approaches maintain relatively stable performance around 0 across all layers and datasets.
* **Model Size Impact:** The Qwen3-32B model (right graph) generally shows a more gradual decline in performance compared to the Qwen3-8B model (left graph), especially for Q-Anchored approaches. The x axis is also scaled differently, with the 8B model only going to layer 30, and the 32B model going to layer 60.
* **Dataset Variation:** The magnitude of the performance drop varies slightly across different datasets, with PopQA showing the most significant decline for Q-Anchored approaches.
### Interpretation
The data suggests that Q-Anchoring leads to a degradation in performance as the model processes deeper layers, potentially indicating issues with information propagation or interference within the network. The stability of A-Anchored approaches implies that anchoring on the answer might provide a more robust representation that is less susceptible to degradation with increasing layer depth. The larger Qwen3-32B model appears to mitigate this performance drop to some extent, possibly due to its increased capacity to handle complex representations. The differences in performance across datasets could be attributed to variations in the complexity or structure of the questions and answers within each dataset. The fact that the A-Anchored models are stable around 0 suggests that they are not learning anything useful.