\n
## Scatter Plot: Confidence vs. Target Length (High School Physics)
### Overview
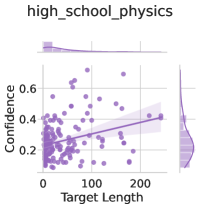
The image presents a scatter plot visualizing the relationship between "Target Length" and "Confidence" for data labeled as "high_school_physics". The plot includes a regression line with a confidence interval, and marginal histograms showing the distributions of each variable.
### Components/Axes
* **Title:** "high\_school\_physics" (top-center)
* **X-axis:** "Target Length" (bottom-center), ranging from approximately 0 to 250.
* **Y-axis:** "Confidence" (left-center), ranging from approximately 0.15 to 0.65.
* **Scatter Points:** Numerous purple dots representing individual data points.
* **Regression Line:** A purple line representing the trend of the data.
* **Confidence Interval:** A shaded purple area around the regression line, indicating the uncertainty in the line's estimate.
* **Marginal Histograms:** Two histograms, one above the scatter plot and one to the right, showing the distributions of "Target Length" and "Confidence" respectively.
### Detailed Analysis
The scatter plot shows a weak positive correlation between "Target Length" and "Confidence".
* **Regression Line Trend:** The regression line slopes slightly upward, indicating that as "Target Length" increases, "Confidence" tends to increase, but the effect is small.
* **Scatter Point Distribution:** The points are widely dispersed, indicating a low degree of correlation. Most points cluster between "Target Length" values of 0 and 150, and "Confidence" values of 0.2 and 0.4.
* **Marginal Histogram - Target Length:** The histogram above the scatter plot is right-skewed, with a peak around a "Target Length" of approximately 20-50. The distribution extends to a maximum "Target Length" of around 250.
* **Marginal Histogram - Confidence:** The histogram to the right of the scatter plot appears roughly uniform, with a slight peak around a "Confidence" of 0.3. The distribution extends from approximately 0.15 to 0.65.
* **Data Points (Approximate Values):**
* (0, 0.15): A cluster of points near the origin.
* (50, 0.3): Several points around this value.
* (100, 0.35): A few points.
* (150, 0.4): A small number of points.
* (200, 0.5): A few scattered points.
* (250, 0.3): A few scattered points.
### Key Observations
* The correlation between "Target Length" and "Confidence" is weak.
* The distribution of "Target Length" is skewed, suggesting that shorter target lengths are more common.
* The distribution of "Confidence" is relatively flat, indicating that confidence levels are fairly evenly distributed.
* There are no obvious outliers.
### Interpretation
The data suggests that, for this "high\_school\_physics" dataset, the length of the "Target" does not strongly predict the "Confidence" associated with it. The weak positive correlation could be due to a number of factors, such as increased familiarity with longer targets or a tendency to be more confident in longer, more complex problems. The skewed distribution of "Target Length" suggests that the dataset may be biased towards shorter targets. The relatively flat distribution of "Confidence" indicates that there is a wide range of confidence levels among the data points. The marginal histograms provide additional context about the distributions of each variable, helping to understand the overall characteristics of the dataset. The confidence interval around the regression line indicates the uncertainty in the estimated relationship between "Target Length" and "Confidence".