## Line Chart: Training and Testing Accuracy vs. Epoch for Different 'd' Values
### Overview
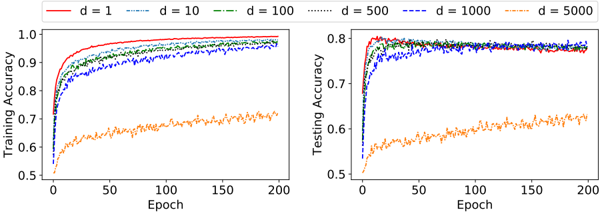
The image presents two line charts side-by-side. The left chart displays Training Accuracy against Epoch, while the right chart shows Testing Accuracy against Epoch. Both charts compare the performance of models with different values of 'd' (1, 10, 100, 500, 1000, and 5000).
### Components/Axes
* **X-axis (Both Charts):** Epoch, ranging from 0 to 200.
* **Y-axis (Left Chart):** Training Accuracy, ranging from 0.5 to 1.0.
* **Y-axis (Right Chart):** Testing Accuracy, ranging from 0.5 to 0.8.
* **Legend (Top-Left):** Labels for each line representing different 'd' values:
* d = 1 (Red solid line)
* d = 10 (Blue dashed line)
* d = 100 (Green dash-dot line)
* d = 500 (Orange dotted line)
* d = 1000 (Purple dotted line)
* d = 5000 (Black solid line)
### Detailed Analysis or Content Details
**Left Chart (Training Accuracy):**
* **d = 1 (Red):** Starts at approximately 0.55, rapidly increases to around 0.95 by Epoch 50, and plateaus around 0.97-0.99 for the remainder of the epochs.
* **d = 10 (Blue):** Starts at approximately 0.55, increases more slowly than d=1, reaching around 0.85 by Epoch 50, and continues to increase, reaching approximately 0.95 by Epoch 200.
* **d = 100 (Green):** Starts at approximately 0.55, increases at a similar rate to d=10, reaching around 0.85 by Epoch 50, and continues to increase, reaching approximately 0.95 by Epoch 200.
* **d = 500 (Orange):** Starts at approximately 0.6, increases slowly, reaching around 0.7 by Epoch 50, and plateaus around 0.72-0.75 for the remainder of the epochs.
* **d = 1000 (Purple):** Starts at approximately 0.6, increases slowly, reaching around 0.7 by Epoch 50, and plateaus around 0.72-0.75 for the remainder of the epochs.
* **d = 5000 (Black):** Starts at approximately 0.55, increases slowly, reaching around 0.7 by Epoch 50, and plateaus around 0.72-0.75 for the remainder of the epochs.
**Right Chart (Testing Accuracy):**
* **d = 1 (Red):** Starts at approximately 0.55, rapidly increases to around 0.9 by Epoch 50, and plateaus around 0.92-0.95 for the remainder of the epochs.
* **d = 10 (Blue):** Starts at approximately 0.55, increases more slowly than d=1, reaching around 0.8 by Epoch 50, and continues to increase, reaching approximately 0.9 by Epoch 200.
* **d = 100 (Green):** Starts at approximately 0.55, increases at a similar rate to d=10, reaching around 0.8 by Epoch 50, and continues to increase, reaching approximately 0.9 by Epoch 200.
* **d = 500 (Orange):** Starts at approximately 0.6, increases slowly, reaching around 0.65 by Epoch 50, and plateaus around 0.67-0.7 for the remainder of the epochs.
* **d = 1000 (Purple):** Starts at approximately 0.6, increases slowly, reaching around 0.65 by Epoch 50, and plateaus around 0.67-0.7 for the remainder of the epochs.
* **d = 5000 (Black):** Starts at approximately 0.6, increases slowly, reaching around 0.65 by Epoch 50, and plateaus around 0.67-0.7 for the remainder of the epochs.
### Key Observations
* Lower values of 'd' (1, 10, 100) achieve significantly higher training and testing accuracy compared to higher values (500, 1000, 5000).
* The lines for d=500, d=1000, and d=5000 are very close to each other in both charts, indicating similar performance.
* There is a noticeable gap between training and testing accuracy for all 'd' values, suggesting some degree of overfitting.
* The training accuracy plateaus much earlier than the testing accuracy for d=1, d=10, and d=100.
### Interpretation
The data suggests that the parameter 'd' plays a crucial role in the performance of the model. Lower values of 'd' lead to better accuracy, both in training and testing. However, the performance plateaus for higher values of 'd', indicating that increasing 'd' beyond a certain point does not improve the model's ability to learn.
The gap between training and testing accuracy suggests that the model is overfitting, especially for lower values of 'd'. This means the model is learning the training data too well and is not generalizing well to unseen data.
The consistent performance of d=500, d=1000, and d=5000 suggests that there might be a limit to the benefit of increasing 'd', and that other factors might be more important for improving performance beyond a certain point. The choice of 'd' represents a trade-off between model complexity and generalization ability. A smaller 'd' may lead to underfitting, while a larger 'd' may lead to overfitting.