## Scatter Plot: Performance vs. Cost Analysis
### Overview
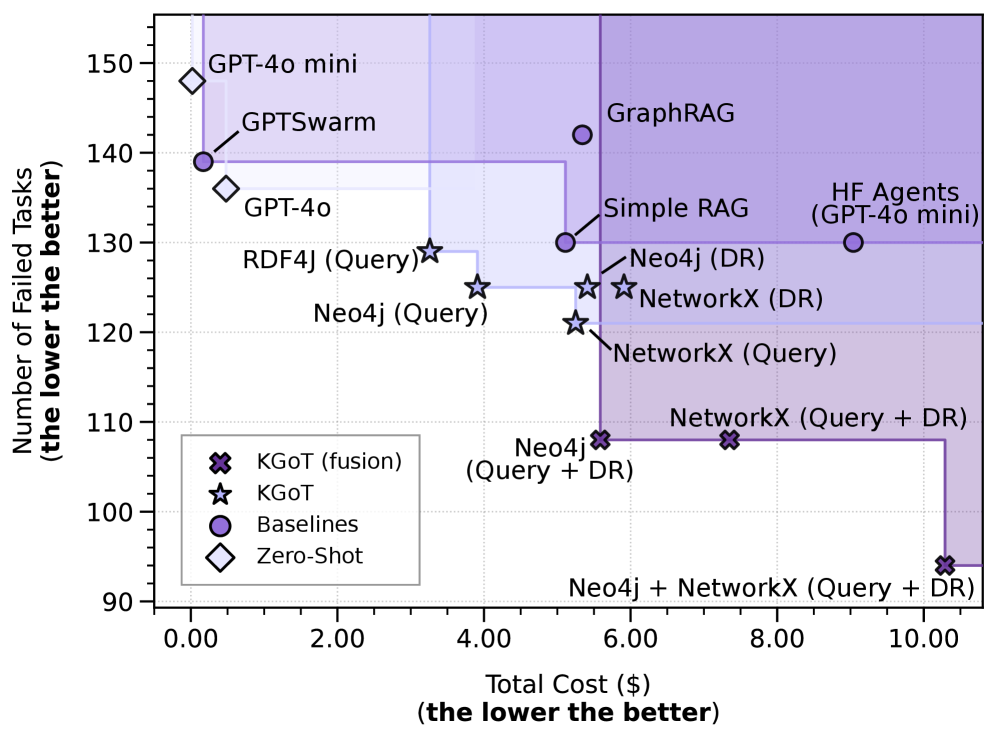
This scatter plot compares the performance (number of failed tasks) and cost (total cost in dollars) of various AI/ML systems and baselines. Lower values on both axes indicate better performance and efficiency. The plot includes labeled data points for specific systems and color-coded categories.
### Components/Axes
- **X-axis (Total Cost $)**: Ranges from 0.00 to 10.00, with the note "(the lower the better)".
- **Y-axis (Number of Failed Tasks)**: Ranges from 90 to 150, with the note "(the lower the better)".
- **Legend**: Located in the bottom-left corner, with four categories:
- **KGoT (fusion)**: Purple crosses (×).
- **KGoT**: Purple stars (★).
- **Baselines**: Purple circles (●).
- **Zero-Shot**: Light purple diamonds (◆).
### Detailed Analysis
#### Data Points and Trends
1. **GPT-4o mini** (◆): Positioned at (0.5, 145), indicating very low cost but high failed tasks.
2. **GPT-4o** (◆): At (1.5, 135), slightly lower cost and fewer failed tasks than GPT-4o mini.
3. **RDF4J (Query)** (★): At (3.5, 125), moderate cost and improved performance.
4. **Neo4j (Query)** (★): At (4.5, 120), better performance than RDF4J.
5. **NetworkX (Query)** (★): At (5.5, 115), further improvement in performance.
6. **Neo4j (Query + DR)** (★): At (6.0, 110), higher cost but significantly lower failed tasks.
7. **NetworkX (Query + DR)** (★): At (7.0, 105), similar trend to Neo4j (Query + DR).
8. **HF Agents (GPT-4o mini)** (●): At (8.5, 130), high cost with moderate performance.
9. **Neo4j + NetworkX (Query + DR)** (×): At (10.5, 90), highest cost but lowest failed tasks.
#### Key Observations
- **Cost-Performance Trade-off**: As total cost increases, the number of failed tasks generally decreases. For example, HF Agents (GPT-4o mini) at $8.50 have 130 failed tasks, while Neo4j + NetworkX (Query + DR) at $10.50 has only 90 failed tasks.
- **Zero-Shot Methods**: Light purple diamonds (◆) like GPT-4o mini and GPT-4o are clustered in the top-left, indicating poor performance despite low cost.
- **KGoT (fusion) and Baselines**: Purple crosses (×) and circles (●) are spread across the plot, suggesting variability in performance and cost.
- **Outliers**: Neo4j + NetworkX (Query + DR) at (10.5, 90) is an outlier with the highest cost but best performance.
### Interpretation
The data highlights a clear trade-off between cost and performance. Systems with higher costs (e.g., HF Agents, Neo4j + NetworkX) achieve fewer failed tasks, but the marginal gains diminish as cost increases. Zero-Shot methods (◆) are inefficient, failing more tasks even at low costs. The KGoT (fusion) and Baselines (●) show mixed results, indicating potential for optimization. The plot suggests that investing in higher-cost systems may yield better performance, but the relationship is not linear, and some systems (e.g., Neo4j + NetworkX) may offer disproportionate benefits.