## Scatter Plot: Cost vs. Failure Rate of AI/Graph-Based Systems
### Overview
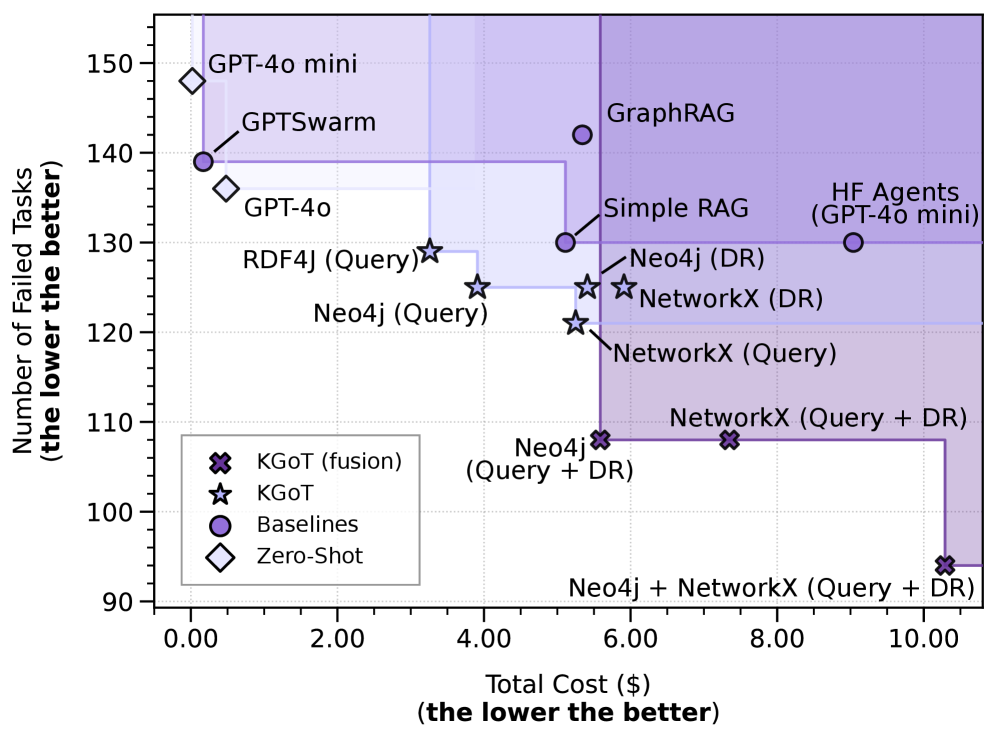
This is a scatter plot comparing various AI systems, graph database methods, and hybrid approaches. It plots their performance on a task suite against their operational cost. The chart uses a dual-axis system with a shaded background gradient and includes a legend to categorize the different method types. The overall message is a trade-off analysis between cost and reliability.
### Components/Axes
* **X-Axis:** "Total Cost ($) (the lower the better)". Scale ranges from 0.00 to 10.00, with major ticks every 2.00 units.
* **Y-Axis:** "Number of Failed Tasks (the lower the better)". Scale ranges from 90 to 150, with major ticks every 10 units.
* **Legend (Bottom-Left):** Contains four categories with distinct markers:
* `KGoT (fusion)`: Purple 'X' marker.
* `KGoT`: Purple star (☆) marker.
* `Baselines`: Purple circle (○) marker.
* `Zero-Shot`: White diamond (◇) marker with a black outline.
* **Background:** A gradient shading from light purple (left) to darker purple (right), possibly indicating increasing cost or complexity zones. A vertical line at approximately x=5.50 divides the plot into two main shaded regions.
### Detailed Analysis
**Data Points (Approximate Coordinates & Labels):**
* **Zero-Shot (White Diamond):**
* `GPT-4o mini`: Positioned at top-left. Coordinates: (~0.10, 148).
* `GPT-4o`: Positioned below the first point. Coordinates: (~0.50, 136).
* **Baselines (Purple Circle):**
* `GPTSwarm`: Positioned near the top-left. Coordinates: (~0.20, 139).
* `GraphRAG`: Positioned in the upper-middle area. Coordinates: (~5.40, 142).
* `Simple RAG`: Positioned below GraphRAG. Coordinates: (~5.20, 130).
* `HF Agents (GPT-4o mini)`: Positioned on the far right. Coordinates: (~9.10, 130).
* **KGoT (Purple Star):**
* `RDF4J (Query)`: Positioned in the middle-left. Coordinates: (~3.30, 129).
* `Neo4j (Query)`: Positioned below RDF4J. Coordinates: (~3.90, 125).
* `Neo4j (DR)`: Positioned in the middle. Coordinates: (~5.50, 125).
* `NetworkX (DR)`: Positioned to the right of Neo4j (DR). Coordinates: (~6.00, 125).
* `NetworkX (Query)`: Positioned below NetworkX (DR). Coordinates: (~5.40, 121).
* **KGoT (fusion) (Purple 'X'):**
* `Neo4j (Query + DR)`: Positioned in the lower-middle area. Coordinates: (~5.60, 108).
* `NetworkX (Query + DR)`: Positioned to the right of the previous point. Coordinates: (~7.40, 108).
* `Neo4j + NetworkX (Query + DR)`: Positioned at the bottom-right. Coordinates: (~10.20, 94).
### Key Observations
1. **Cost-Performance Frontier:** The most efficient systems (lowest cost and lowest failures) are the `KGoT (fusion)` methods, particularly `Neo4j + NetworkX (Query + DR)`, which achieves the lowest failure count (~94) at the highest cost (~$10.20).
2. **Zero-Shot Inefficiency:** The `Zero-Shot` methods (`GPT-4o`, `GPT-4o mini`) have very low cost but the highest failure rates (136-148), indicating poor reliability without additional systems.
3. **Baseline Spread:** `Baselines` show a wide cost range. `GPTSwarm` is cheap but unreliable, while `HF Agents` is very expensive with mediocre performance (~130 failures). `GraphRAG` and `Simple RAG` cluster in the middle cost range with varying failure rates.
4. **KGoT Improvement:** Within the `KGoT` (star) category, adding "DR" (likely Data Retrieval or a similar component) generally lowers failure rates compared to "Query"-only methods at a similar cost point.
5. **Fusion Advantage:** The `KGoT (fusion)` methods consistently outperform their non-fusion `KGoT` counterparts, achieving significantly lower failure rates (108 vs. 121-125) for a moderate increase in cost.
### Interpretation
The chart demonstrates a clear Pareto frontier where improved reliability (fewer failed tasks) comes at the expense of higher monetary cost. The data suggests that:
* **Simple, cheap approaches (Zero-Shot) are not viable** for tasks requiring high reliability.
* **Hybrid and fusion architectures (`KGoT (fusion)`)** represent the state-of-the-art in this comparison, successfully trading increased computational cost for a substantial gain in robustness. The combination of multiple graph systems (`Neo4j + NetworkX`) yields the best performance, albeit at the highest cost.
* There is a **diminishing returns** pattern: moving from the worst to mid-tier systems yields large failure rate reductions for small cost increases, but pushing to the absolute best performance requires a disproportionately large cost investment.
* The **vertical line at ~$5.50** may represent a significant cost threshold or a boundary between different architectural paradigms (e.g., single vs. multi-system approaches).
The visualization effectively argues that for complex task suites, investing in sophisticated, fused graph-based reasoning systems (`KGoT (fusion)`) is justified by their superior reliability, despite the higher operational cost.