\n
## Chart: Energy To Solution vs. Saturation Parameter
### Overview
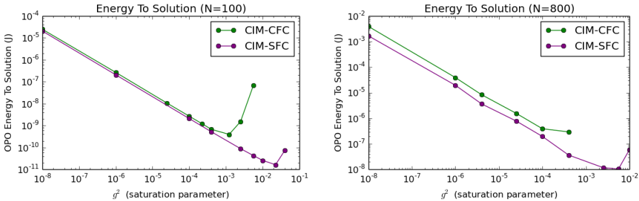
The image presents two charts comparing the "Energy To Solution" for two methods, CIM-CFC (green) and CIM-SFC (purple), across varying saturation parameters (represented by 'J'). The left chart displays data for N=100, while the right chart shows data for N=800. Both charts use a logarithmic scale for the Y-axis (Energy To Solution) and a logarithmic scale for the X-axis (Saturation Parameter).
### Components/Axes
* **X-axis Label (Both Charts):** J (saturation parameter)
* **Y-axis Label (Both Charts):** OPO Energy To Solution (J)
* **Left Chart Title:** Energy To Solution (N=100)
* **Right Chart Title:** Energy To Solution (N=800)
* **Legend (Both Charts):**
* Green Line: CIM-CFC
* Purple Line: CIM-SFC
* **X-axis Scale (Both Charts):** Logarithmic, ranging from approximately 10<sup>-8</sup> to 10<sup>2</sup>.
* **Y-axis Scale (Left Chart):** Logarithmic, ranging from approximately 10<sup>-11</sup> to 10<sup>4</sup>.
* **Y-axis Scale (Right Chart):** Logarithmic, ranging from approximately 10<sup>-8</sup> to 10<sup>-2</sup>.
### Detailed Analysis or Content Details
**Left Chart (N=100):**
* **CIM-CFC (Green Line):** The line initially slopes downward from approximately 10<sup>3</sup> at J = 10<sup>-8</sup> to approximately 10<sup>-2</sup> at J = 10<sup>-3</sup>. It then increases sharply to approximately 10<sup>1</sup> at J = 10<sup>-2</sup>.
* Approximate Data Points:
* J = 10<sup>-8</sup>: 10<sup>3</sup>
* J = 10<sup>-7</sup>: 10<sup>2</sup>
* J = 10<sup>-6</sup>: 10<sup>1</sup>
* J = 10<sup>-5</sup>: 10<sup>0</sup>
* J = 10<sup>-4</sup>: 10<sup>-1</sup>
* J = 10<sup>-3</sup>: 10<sup>-2</sup>
* J = 10<sup>-2</sup>: 10<sup>1</sup>
* **CIM-SFC (Purple Line):** The line slopes downward from approximately 10<sup>2</sup> at J = 10<sup>-8</sup> to approximately 10<sup>-4</sup> at J = 10<sup>-2</sup>.
* Approximate Data Points:
* J = 10<sup>-8</sup>: 10<sup>2</sup>
* J = 10<sup>-7</sup>: 10<sup>1</sup>
* J = 10<sup>-6</sup>: 10<sup>0</sup>
* J = 10<sup>-5</sup>: 10<sup>-1</sup>
* J = 10<sup>-4</sup>: 10<sup>-2</sup>
* J = 10<sup>-3</sup>: 10<sup>-3</sup>
* J = 10<sup>-2</sup>: 10<sup>-4</sup>
**Right Chart (N=800):**
* **CIM-CFC (Green Line):** The line slopes downward from approximately 10<sup>-2</sup> at J = 10<sup>-8</sup> to approximately 10<sup>-4</sup> at J = 10<sup>-2</sup>.
* Approximate Data Points:
* J = 10<sup>-8</sup>: 10<sup>-2</sup>
* J = 10<sup>-7</sup>: 10<sup>-3</sup>
* J = 10<sup>-6</sup>: 10<sup>-3</sup>
* J = 10<sup>-5</sup>: 10<sup>-3</sup>
* J = 10<sup>-4</sup>: 10<sup>-3</sup>
* J = 10<sup>-3</sup>: 10<sup>-3</sup>
* J = 10<sup>-2</sup>: 10<sup>-4</sup>
* **CIM-SFC (Purple Line):** The line slopes downward from approximately 10<sup>-3</sup> at J = 10<sup>-8</sup> to approximately 10<sup>-5</sup> at J = 10<sup>-2</sup>.
* Approximate Data Points:
* J = 10<sup>-8</sup>: 10<sup>-3</sup>
* J = 10<sup>-7</sup>: 10<sup>-4</sup>
* J = 10<sup>-6</sup>: 10<sup>-4</sup>
* J = 10<sup>-5</sup>: 10<sup>-4</sup>
* J = 10<sup>-4</sup>: 10<sup>-4</sup>
* J = 10<sup>-3</sup>: 10<sup>-4</sup>
* J = 10<sup>-2</sup>: 10<sup>-5</sup>
### Key Observations
* For both N=100 and N=800, CIM-SFC consistently requires less energy to solution than CIM-CFC across the entire range of saturation parameters.
* The CIM-CFC method (N=100) exhibits a significant increase in energy required at higher saturation parameters (J = 10<sup>-2</sup>), which is not observed in the other datasets.
* Increasing N from 100 to 800 generally reduces the energy required for both methods, and smooths out the curve for CIM-CFC.
* Both charts show a general trend of decreasing energy to solution as the saturation parameter increases, until a certain point (especially noticeable in the N=100 chart for CIM-CFC).
### Interpretation
The charts demonstrate the relationship between energy expenditure and saturation parameter for two computational methods, CIM-CFC and CIM-SFC. The consistent lower energy requirement of CIM-SFC suggests it is a more efficient method for achieving a solution. The value of N (number of iterations or samples) significantly impacts the energy profile, with higher N values leading to lower energy consumption and smoother convergence.
The anomalous behavior of CIM-CFC at N=100 and higher saturation parameters suggests potential instability or a limitation of the method under those conditions. The increase in energy required could indicate that the algorithm struggles to converge or requires significantly more computational effort to reach a solution. The smoothing of this curve at N=800 indicates that increasing the number of iterations mitigates this instability.
The logarithmic scales on both axes highlight the wide range of energy values and saturation parameters being considered. This suggests that the methods are sensitive to the saturation parameter, and that even small changes in J can have a substantial impact on the energy required to reach a solution. The data suggests that there is an optimal range for the saturation parameter where the energy expenditure is minimized.