## Chart Type: Multiple Line Charts Comparing Reasoning Methods
### Overview
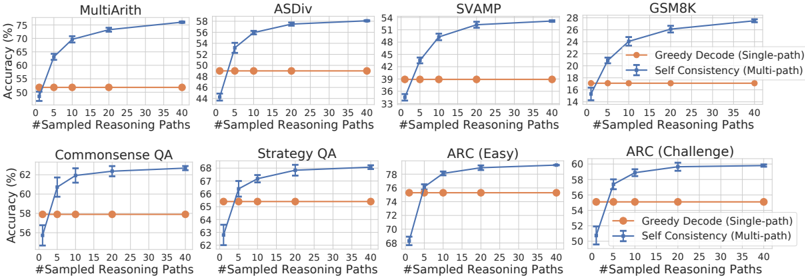
The image presents eight line charts arranged in a 2x4 grid. Each chart compares the accuracy (%) of two reasoning methods, "Greedy Decode (Single-path)" and "Self Consistency (Multi-path)", across different numbers of sampled reasoning paths (from 0 to 40). The charts are grouped by the task they evaluate: MultiArith, ASDiv, SVAMP, GSM8K, Commonsense QA, Strategy QA, ARC (Easy), and ARC (Challenge).
### Components/Axes
* **X-axis (Horizontal):** "#Sampled Reasoning Paths". The scale ranges from 0 to 40 in increments of 5.
* **Y-axis (Vertical):** "Accuracy (%)". The scale varies for each chart, but generally covers a range relevant to the observed accuracy.
* **Legend (Right of GSM8K and ARC(Challenge) charts):**
* Orange line with circular markers: "Greedy Decode (Single-path)"
* Blue line with error bars: "Self Consistency (Multi-path)"
* **Chart Titles:**
* Top Row: MultiArith, ASDiv, SVAMP, GSM8K
* Bottom Row: Commonsense QA, Strategy QA, ARC (Easy), ARC (Challenge)
### Detailed Analysis
**1. MultiArith**
* Y-axis: 50 to 75
* Greedy Decode (Single-path) (Orange): Constant at approximately 51%.
* Self Consistency (Multi-path) (Blue): Starts at approximately 51% and increases sharply to approximately 75% by 40 sampled reasoning paths.
**2. ASDiv**
* Y-axis: 44 to 58
* Greedy Decode (Single-path) (Orange): Constant at approximately 49%.
* Self Consistency (Multi-path) (Blue): Starts at approximately 45% and increases to approximately 58% by 40 sampled reasoning paths.
**3. SVAMP**
* Y-axis: 33 to 54
* Greedy Decode (Single-path) (Orange): Constant at approximately 39%.
* Self Consistency (Multi-path) (Blue): Starts at approximately 36% and increases to approximately 53% by 40 sampled reasoning paths.
**4. GSM8K**
* Y-axis: 14 to 28
* Greedy Decode (Single-path) (Orange): Constant at approximately 17%.
* Self Consistency (Multi-path) (Blue): Starts at approximately 16% and increases to approximately 28% by 40 sampled reasoning paths.
**5. Commonsense QA**
* Y-axis: 56 to 63
* Greedy Decode (Single-path) (Orange): Constant at approximately 58%.
* Self Consistency (Multi-path) (Blue): Starts at approximately 57% and increases to approximately 62% by 40 sampled reasoning paths.
**6. Strategy QA**
* Y-axis: 62 to 68
* Greedy Decode (Single-path) (Orange): Constant at approximately 65%.
* Self Consistency (Multi-path) (Blue): Starts at approximately 63% and increases to approximately 68% by 40 sampled reasoning paths.
**7. ARC (Easy)**
* Y-axis: 68 to 78
* Greedy Decode (Single-path) (Orange): Constant at approximately 76%.
* Self Consistency (Multi-path) (Blue): Starts at approximately 68% and increases to approximately 78% by 40 sampled reasoning paths.
**8. ARC (Challenge)**
* Y-axis: 50 to 60
* Greedy Decode (Single-path) (Orange): Constant at approximately 55%.
* Self Consistency (Multi-path) (Blue): Starts at approximately 50% and increases to approximately 60% by 40 sampled reasoning paths.
### Key Observations
* The "Self Consistency (Multi-path)" method consistently shows improved accuracy as the number of sampled reasoning paths increases across all tasks.
* The "Greedy Decode (Single-path)" method maintains a relatively constant accuracy regardless of the number of sampled reasoning paths.
* The magnitude of improvement from "Self Consistency" varies across tasks. MultiArith shows the most significant improvement, while Strategy QA shows the least.
* Error bars are present on the "Self Consistency" data, indicating the variability in the results.
### Interpretation
The data suggests that using multiple reasoning paths ("Self Consistency") generally improves the accuracy of the model compared to using a single reasoning path ("Greedy Decode"). The improvement is more pronounced for some tasks (e.g., MultiArith, SVAMP, GSM8K) than others (e.g., Strategy QA, Commonsense QA). This could be due to the nature of the tasks themselves, where some tasks benefit more from exploring multiple reasoning strategies. The constant accuracy of "Greedy Decode" indicates that simply increasing the number of samples without exploring diverse reasoning paths does not lead to better performance. The error bars on the "Self Consistency" data suggest that the improvement is not always consistent and may depend on the specific samples used.