\n
## Diagram: Representation of a Phase Diagram
### Overview
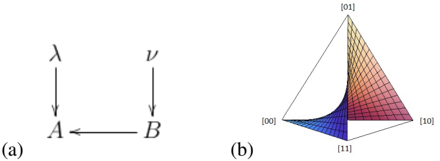
The image presents two diagrams, labeled (a) and (b). Diagram (a) is a 2D representation with labeled axes, while diagram (b) is a 3D surface plot. Both appear to relate to a phase diagram, likely in materials science or physics. The diagrams are positioned side-by-side, with (a) on the left and (b) on the right.
### Components/Axes
**Diagram (a):**
* **Axes:**
* Vertical axis labeled "λ" (lambda).
* Horizontal axis labeled "ν" (nu).
* **Points:** Two points are labeled "A" and "B".
* **Arrows:** Arrows indicate the direction of increasing values along each axis.
**Diagram (b):**
* **Axes:** The axes are represented by the corners of the triangular base of the plot.
* One corner is labeled "[00]".
* Another corner is labeled "[01]".
* The final corner is labeled "[10]".
* The third dimension (height) is not explicitly labeled, but represents a value dependent on the two base axes.
* **Surface:** A colored surface plot is displayed, with color gradients indicating varying values.
### Detailed Analysis or Content Details
**Diagram (a):**
This diagram is a simple 2D coordinate system. The points A and B are positioned within this space. The axes λ and ν likely represent parameters defining a system's state. Without further context, the specific meaning of these parameters is unknown.
**Diagram (b):**
The 3D plot shows a surface that appears to be a minimum. The surface is colored with a gradient, transitioning from blue at the lower values to red at the higher values. The plot is bounded by a triangle with vertices at [00], [01], and [10]. The surface is lowest near the center of the triangle and rises towards the edges. The color gradient suggests a continuous variation in the value represented by the height of the surface.
### Key Observations
* Diagram (a) provides a basic coordinate system, while diagram (b) visualizes a function of two variables.
* The surface in diagram (b) has a minimum, suggesting a stable state or optimal condition.
* The axes in diagram (b) are labeled with bracketed numbers, which could represent composition or other material properties.
* The color gradient in diagram (b) is consistent, with blue representing lower values and red representing higher values.
### Interpretation
These diagrams likely represent a phase diagram or a potential energy surface. Diagram (a) could be a simplified representation of the parameters influencing the system, while diagram (b) shows the resulting behavior. The minimum in diagram (b) could correspond to the most stable phase or configuration of the system. The axes [00], [01], and [10] likely represent the composition of different components in a mixture. The color gradient indicates the energy or stability of different compositions.
Without additional context, it is difficult to determine the specific system being represented. However, the diagrams suggest a relationship between parameters λ and ν (in diagram a) and the composition of a material (in diagram b), and how these factors influence the system's stability. The diagrams are likely used to predict the behavior of the system under different conditions.