## Dual-Axis Line Chart: Comparison of Best-of-8 and Extracted ProcessBench Accuracy
### Overview
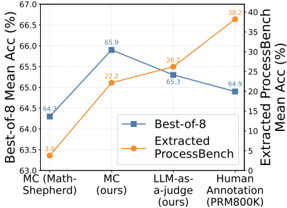
This chart displays a comparative analysis of two performance metrics—"Best-of-8 Mean Acc (%)" and "Extracted ProcessBench Mean Acc (%)"—across four distinct evaluation or annotation methods. The chart utilizes a dual-axis system to plot these metrics, revealing how different methodologies impact the two performance scores differently.
### Components/Axes
* **Left Y-Axis:** Labeled "Best-of-8 Mean Acc (%)". The scale ranges from 63.0 to 67.0 with increments of 0.5.
* **Right Y-Axis:** Labeled "Extracted ProcessBench Mean Acc (%)". The scale ranges from 0 to 40 with increments of 5.
* **X-Axis:** Categorical axis containing four methods, ordered from left to right:
1. MC (Math-Shepherd)
2. MC (ours)
3. LLM-as-a-judge (ours)
4. Human Annotation (PRM800K)
* **Legend:** Located in the bottom-right quadrant of the chart area.
* Blue square marker: "Best-of-8"
* Orange circle marker: "Extracted ProcessBench"
### Detailed Analysis
#### Data Series 1: Best-of-8 (Blue Line with Square Markers)
* **Trend:** The line slopes upward from the first to the second category, then slopes downward through the third and fourth categories.
* **Values:**
* **MC (Math-Shepherd):** 64.3%
* **MC (ours):** 65.9% (Peak value for this series)
* **LLM-as-a-judge (ours):** 65.3%
* **Human Annotation (PRM800K):** 64.9%
#### Data Series 2: Extracted ProcessBench (Orange Line with Circle Markers)
* **Trend:** The line exhibits a consistent, steep upward slope across all four categories, indicating a positive correlation with the progression of the methods.
* **Values:**
* **MC (Math-Shepherd):** 3.8%
* **MC (ours):** 22.2%
* **LLM-as-a-judge (ours):** 26.2%
* **Human Annotation (PRM800K):** 38.2% (Peak value for this series)
### Key Observations
* **Inverse Relationship:** After the second category ("MC (ours)"), the two metrics diverge. While the "Extracted ProcessBench" accuracy continues to climb significantly, the "Best-of-8" accuracy begins to decline.
* **Peak Performance:** "MC (ours)" is the optimal method for the "Best-of-8" metric, whereas "Human Annotation (PRM800K)" is the optimal method for the "Extracted ProcessBench" metric.
* **Magnitude of Change:** The "Extracted ProcessBench" metric shows a much wider range of variance (from ~3.8% to ~38.2%) compared to the "Best-of-8" metric (from ~64.3% to ~65.9%).
### Interpretation
The data suggests a clear trade-off between the two evaluation metrics. The "MC (ours)" method appears highly effective at optimizing for "Best-of-8" accuracy, outperforming even the human-annotated baseline in that specific metric. However, it is significantly less effective at achieving high "Extracted ProcessBench" accuracy compared to the human-annotated baseline.
The "Human Annotation (PRM800K)" serves as the gold standard for the "Extracted ProcessBench" metric, showing the highest performance by a wide margin. The fact that "Best-of-8" accuracy drops when moving from "MC (ours)" to "Human Annotation" suggests that the models or methods optimized for "Best-of-8" may be overfitting to that specific metric or that the "ProcessBench" alignment does not necessarily translate to higher "Best-of-8" performance. This indicates that these two metrics likely measure different aspects of model capability, and optimizing for one may come at the expense of the other.