\n
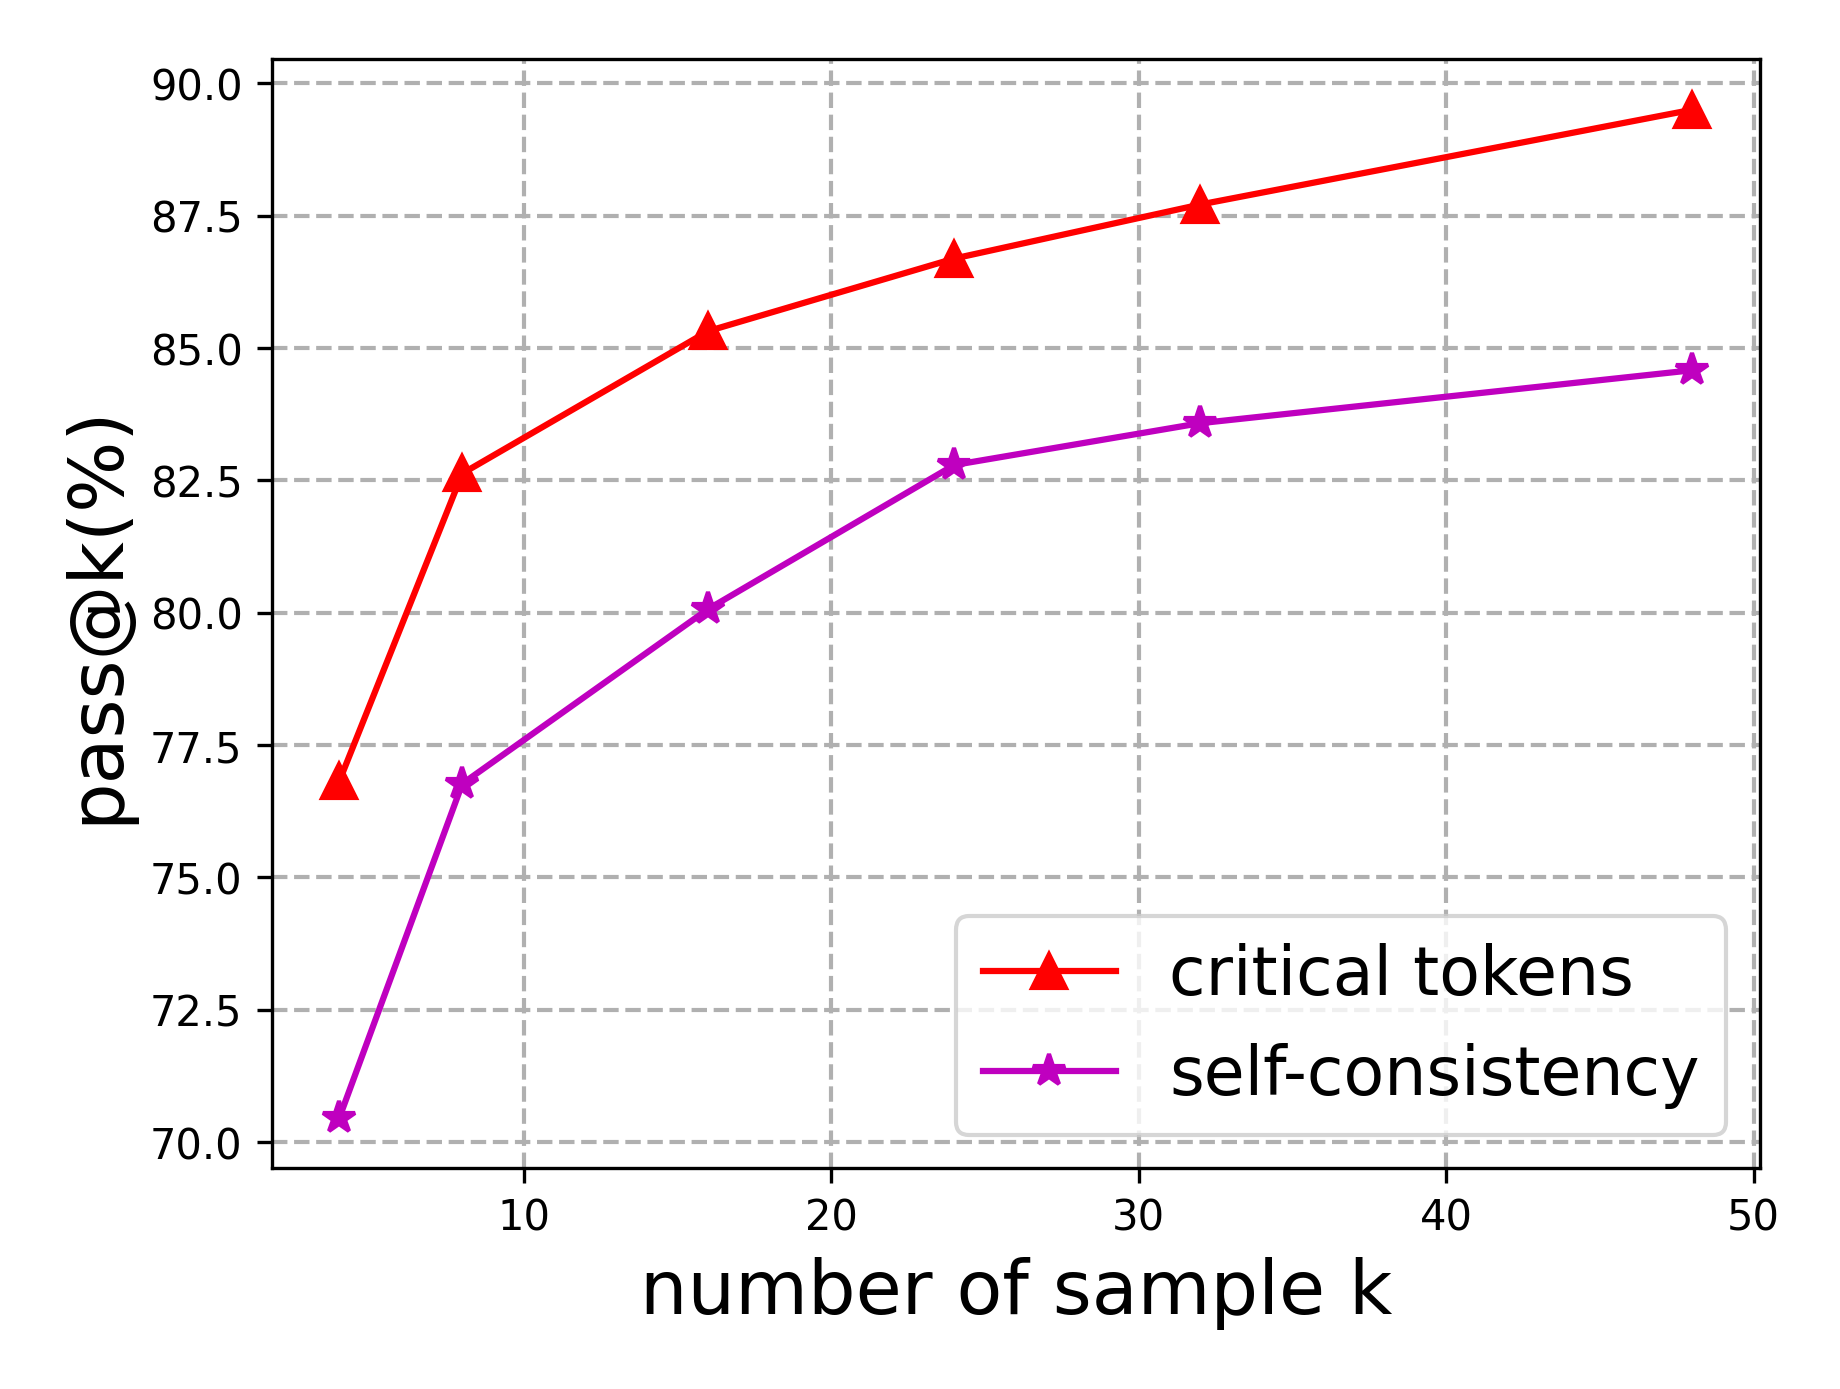
## Line Chart: Pass@k vs. Number of Sample k
### Overview
This line chart illustrates the relationship between the "number of sample k" and the "pass@k (%)" metric for two different methods: "critical tokens" and "self-consistency". The chart displays how the percentage of successful passes (pass@k) changes as the number of samples (k) increases.
### Components/Axes
* **X-axis:** "number of sample k", ranging from 0 to 50, with markers at 0, 10, 20, 30, 40, and 50.
* **Y-axis:** "pass@k (%)", ranging from 70% to 90%, with markers at 70%, 72.5%, 75%, 77.5%, 80%, 82.5%, 85%, 87.5%, and 90%.
* **Legend:** Located in the bottom-right corner, identifying two data series:
* "critical tokens" - represented by a red line with triangle markers.
* "self-consistency" - represented by a purple line with star markers.
* **Gridlines:** Vertical dashed gridlines are present to aid in reading values.
### Detailed Analysis
**Critical Tokens (Red Line):**
The "critical tokens" line slopes generally upward, indicating an increase in pass@k as the number of samples (k) increases.
* At k = 0, pass@k is approximately 81%.
* At k = 10, pass@k is approximately 83%.
* At k = 20, pass@k is approximately 85%.
* At k = 30, pass@k is approximately 86%.
* At k = 40, pass@k is approximately 88%.
* At k = 50, pass@k is approximately 89%.
**Self-Consistency (Purple Line):**
The "self-consistency" line also slopes upward, but at a slower rate than the "critical tokens" line.
* At k = 0, pass@k is approximately 71%.
* At k = 10, pass@k is approximately 77%.
* At k = 20, pass@k is approximately 80%.
* At k = 30, pass@k is approximately 82%.
* At k = 40, pass@k is approximately 84%.
* At k = 50, pass@k is approximately 85%.
### Key Observations
* The "critical tokens" method consistently outperforms the "self-consistency" method across all values of k.
* Both methods show diminishing returns as k increases. The rate of improvement in pass@k decreases as k gets larger.
* The initial increase in pass@k is more pronounced for the "self-consistency" method between k=0 and k=10.
### Interpretation
The data suggests that increasing the number of samples (k) generally improves the pass@k metric for both "critical tokens" and "self-consistency" methods. However, the "critical tokens" method is more effective at achieving higher pass rates, especially as the number of samples increases. This could indicate that identifying and utilizing critical tokens is a more efficient strategy for improving performance than relying solely on self-consistency. The diminishing returns observed at higher values of k suggest that there is a point beyond which increasing the number of samples provides minimal additional benefit. This information is valuable for optimizing the sampling process and balancing performance gains with computational cost. The difference in initial slope suggests that self-consistency benefits more from a small number of samples, while critical tokens maintain a more consistent improvement.