## Line Graph: Pass@k Performance Comparison
### Overview
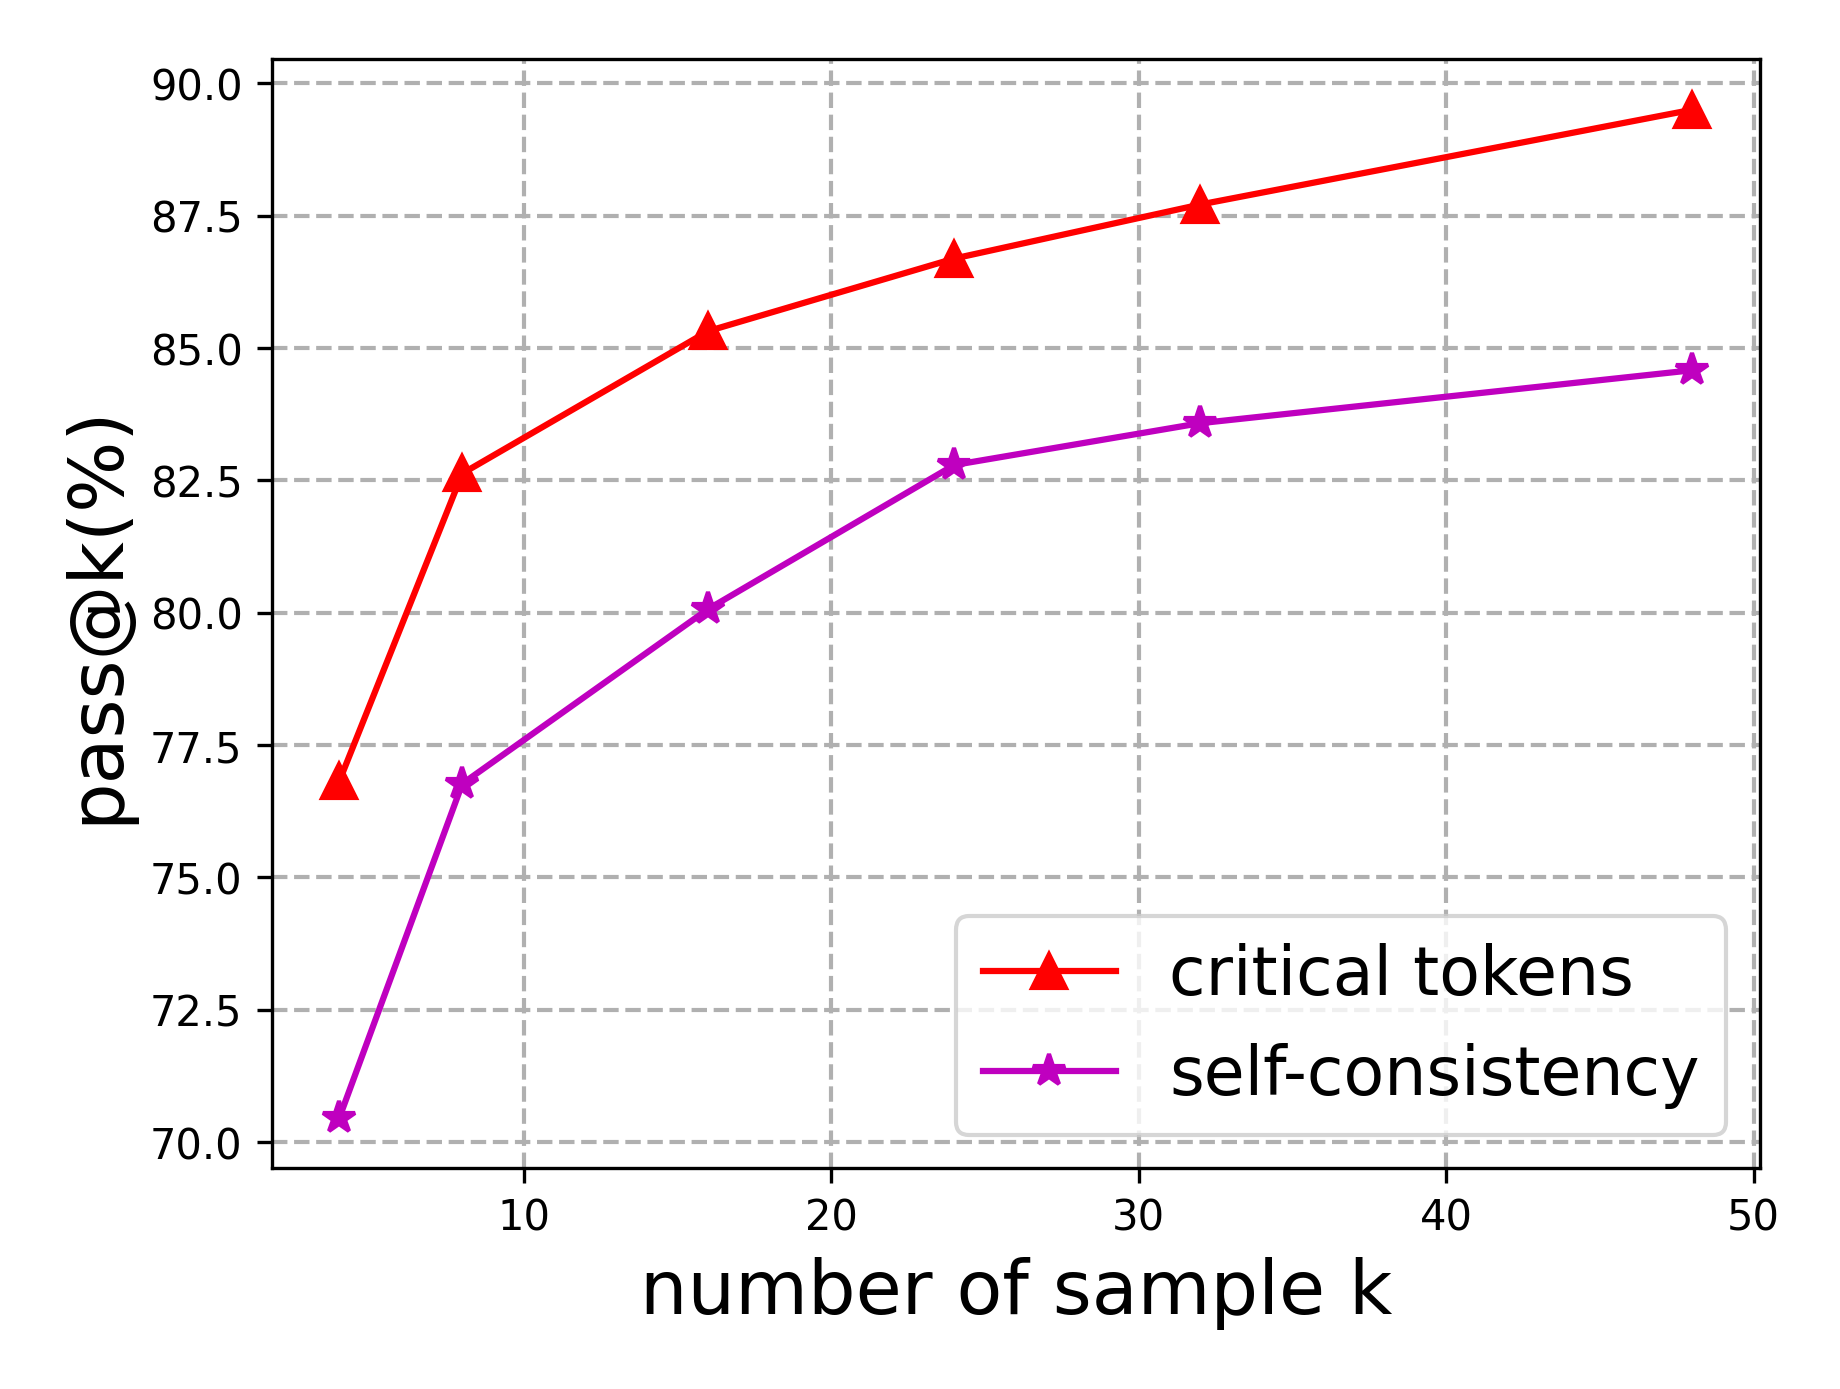
The image depicts a line graph comparing two performance metrics ("critical tokens" and "self-consistency") across varying sample sizes (k). Both metrics show improvement as sample size increases, with "critical tokens" consistently outperforming "self-consistency."
### Components/Axes
- **X-axis**: "number of sample k" (ranges from 0 to 50, with markers at 10, 20, 30, 40, 50).
- **Y-axis**: "pass@k(%)" (ranges from 70% to 90%, with markers at 72.5%, 75%, 77.5%, 80%, 82.5%, 85%, 87.5%, 90%).
- **Legend**: Located in the bottom-right corner, with:
- Red triangles labeled "critical tokens"
- Purple stars labeled "self-consistency"
### Detailed Analysis
1. **Critical Tokens (Red Line)**:
- Starts at ~77% when k=5.
- Increases steadily to ~89% at k=50.
- Slope: Steeper upward trend compared to "self-consistency."
- Key data points:
- k=10: ~82.5%
- k=20: ~85%
- k=30: ~86.5%
- k=40: ~88%
- k=50: ~89%
2. **Self-Consistency (Purple Line)**:
- Starts at ~70% when k=5.
- Increases to ~84% at k=50.
- Slope: Gradual upward trend, less steep than "critical tokens."
- Key data points:
- k=10: ~77%
- k=20: ~80%
- k=30: ~83%
- k=40: ~83.5%
- k=50: ~84%
### Key Observations
- Both metrics show **positive correlation** between sample size (k) and performance (pass@k).
- "Critical tokens" maintains a **~5–6% performance advantage** over "self-consistency" across all sample sizes.
- The performance gap narrows slightly at higher k values (e.g., ~5% at k=5 vs. ~4.5% at k=50).
- No outliers or anomalies detected in either dataset.
### Interpretation
The data suggests that "critical tokens" are a more effective method for improving pass@k performance compared to "self-consistency," particularly at smaller sample sizes. While both approaches benefit from increased sampling, the efficiency of "critical tokens" implies it may be preferable in resource-constrained scenarios. The narrowing gap at larger k values hints at potential convergence, but "critical tokens" retains a consistent edge, indicating inherent methodological advantages. This could inform optimization strategies in systems where token selection or consistency mechanisms are critical.