## Call Trace: Function Execution Times
### Overview
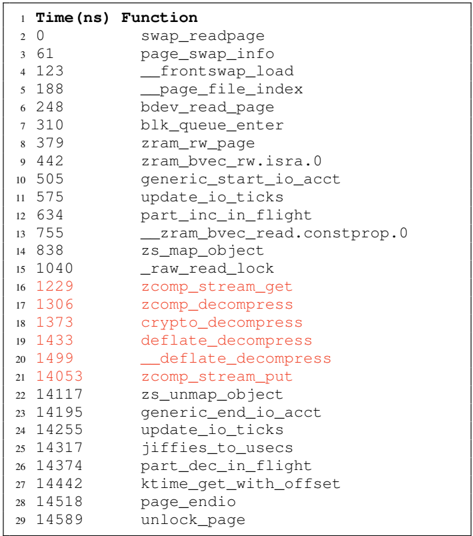
The image presents a call trace, displaying the execution time (in nanoseconds) for a sequence of function calls. The data is organized in two columns: "Time (ns)" and "Function". Some of the time values and function names are highlighted in red, possibly indicating functions related to compression or decompression.
### Components/Axes
* **Column 1 Header:** Time (ns) - Represents the time elapsed in nanoseconds.
* **Column 2 Header:** Function - Represents the name of the function being called.
* **Data:** The table contains a list of function calls and their corresponding execution times.
### Detailed Analysis or ### Content Details
Here's a breakdown of the data, noting the red-highlighted entries:
| Row | Time (ns) | Function | Color |
|-----|-----------|--------------------------------|---------|
| 1 | 0 | swap\_readpage | Black |
| 2 | 61 | page\_swap\_info | Black |
| 3 | 123 | \_frontswap\_load | Black |
| 4 | 188 | \_page\_file\_index | Black |
| 5 | 248 | bdev\_read\_page | Black |
| 6 | 310 | blk\_queue\_enter | Black |
| 7 | 379 | zram\_rw\_page | Black |
| 8 | 442 | zram\_bvec\_rw.isra.0 | Black |
| 9 | 505 | generic\_start\_io\_acct | Black |
| 10 | 575 | update\_io\_ticks | Black |
| 11 | 634 | part\_inc\_in\_flight | Black |
| 12 | 755 | \_zram\_bvec\_read.constprop.0 | Black |
| 13 | 838 | zs\_map\_object | Black |
| 14 | 1040 | \_raw\_read\_lock | Black |
| 15 | 1229 | zcomp\_stream\_get | Red |
| 16 | 1306 | zcomp\_decompress | Red |
| 17 | 1373 | crypto\_decompress | Red |
| 18 | 1433 | deflate\_decompress | Red |
| 19 | 1499 | \_deflate\_decompress | Red |
| 20 | 14053 | zcomp\_stream\_put | Red |
| 21 | 14117 | zs\_unmap\_object | Black |
| 22 | 14195 | generic\_end\_io\_acct | Black |
| 23 | 14255 | update\_io\_ticks | Black |
| 24 | 14317 | jiffies\_to\_usecs | Black |
| 25 | 14374 | part\_dec\_in\_flight | Black |
| 26 | 14442 | ktime\_get\_with\_offset | Black |
| 27 | 14518 | page\_endio | Black |
| 28 | 14589 | unlock\_page | Black |
### Key Observations
* The initial function calls (rows 1-14) have relatively small execution times, ranging from 0 to 1040 ns.
* The functions highlighted in red (rows 15-20) are related to compression and decompression.
* The `zcomp_stream_put` function (row 20) has a significantly larger execution time (14053 ns) compared to the other compression/decompression functions.
* The remaining function calls (rows 21-28) have execution times in the range of 14117 to 14589 ns.
### Interpretation
The call trace provides insights into the performance of different functions within the system. The red highlighting suggests a focus on compression/decompression operations. The significantly longer execution time of `zcomp_stream_put` compared to other compression-related functions indicates that this function might be a performance bottleneck or involve more complex operations. The data suggests that the initial setup and read operations are relatively fast, while the compression and decompression stages, particularly putting the stream, take considerably longer. The final set of functions appears to be related to cleanup and finalization, occurring after a significant delay.