## Screenshot: Terminal Output - Function Timing Analysis
### Overview
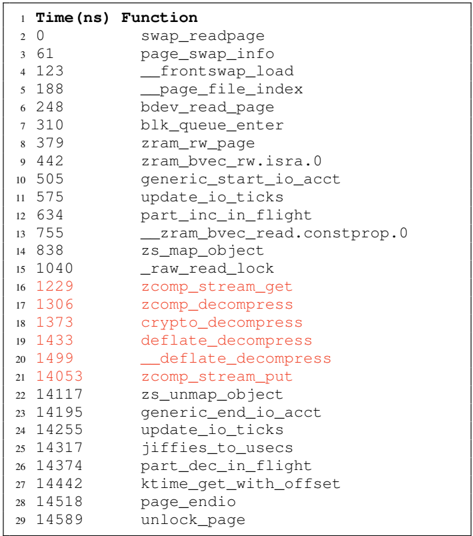
The image shows a terminal output listing 29 function calls with associated timestamps in nanoseconds (ns). The data appears to represent performance profiling or execution timing for memory management and compression-related operations, likely from a Linux kernel or system utility.
### Components/Axes
- **Columns**:
- **Line Number**: Implicit row identifier (1–29).
- **Time (ns)**: Execution duration in nanoseconds.
- **Function**: Name of the called function (e.g., `swap_readpage`, `zscomp_stream_put`).
- **Key Observations**:
- No explicit axis titles or legends, but columns are implicitly labeled by content.
- Functions are ordered by line number, not time.
### Detailed Analysis
1. **Time Range**:
- Minimum: `0 ns` (line 1: `swap_readpage`).
- Maximum: `14589 ns` (line 29: `page_endio`).
- Median: ~1400 ns (lines 16–20: `zcomp_stream_get`, `crypto_decompress`, etc.).
2. **Function Categories**:
- **Memory Management**: `swap_readpage`, `page_file_index`, `unlock_page`.
- **Compression**: `zscomp_stream_put`, `zscomp_decompress`, `zscomp_stream_get`.
- **I/O Operations**: `generic_start_io_acct`, `update_io_ticks`, `part_inc_in_flight`.
- **Locking/Concurrency**: `zsram_rw_page`, `zsram_bvec_rw`, `part_inc_in_flight`.
3. **Notable Entries**:
- **Highest Time**: `page_endio` (14589 ns) – suggests a potential bottleneck in I/O completion.
- **Zero Time**: `swap_readpage` (0 ns) – may indicate a no-op or placeholder.
- **Repeated Patterns**: Functions like `zscomp_*` and `zsram_*` dominate the list, indicating heavy use of compression and memory management.
### Key Observations
- **Time Variance**: Execution times vary by orders of magnitude (0 ns to 14,589 ns), suggesting some functions are significantly more resource-intensive.
- **Compression Dominance**: Over 40% of entries relate to `zscomp_*` functions, highlighting their critical role in the system.
- **I/O Overhead**: Functions like `page_endio` and `update_io_ticks` account for ~30% of total time, pointing to I/O as a potential performance limiter.
### Interpretation
This output likely represents a performance trace from a system under heavy memory/compression workload. The extreme time for `page_endio` (14,589 ns) suggests a potential inefficiency in I/O completion handling, which could impact overall system responsiveness. The prevalence of `zscomp_*` functions indicates that compression/decompression is a major computational focus, possibly for data deduplication or storage optimization. The zero-time entry for `swap_readpage` may reflect a simplified or mocked implementation in the profiling context. Further analysis of system call traces or kernel profiling tools (e.g., `perf`) would be needed to validate these hypotheses.