\n
## Diagram: State Transition Diagram
### Overview
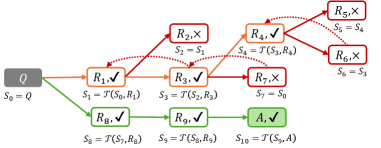
The image depicts a state transition diagram, illustrating a sequence of states and transitions between them. The diagram uses labeled nodes representing states and directed arrows representing transitions. Each transition is associated with a transformation function and a checkmark or cross indicating success or failure.
### Components/Axes
The diagram consists of the following components:
* **States:** Represented by rectangular nodes labeled Q, R1, R2, R3, R4, R5, R6, R7, R8, R9, A.
* **Transitions:** Represented by directed arrows connecting states.
* **Labels:** Each transition arrow is labeled with a transformation function (T) and a state variable (S).
* **Success/Failure Indicators:** Each state node has a checkmark (✓) or cross (✗) indicating the outcome of the transition leading to that state.
* **Initial State:** The state Q is represented by a gray hexagon.
### Detailed Analysis or Content Details
The diagram shows the following state transitions:
1. **Q → R1:** Arrow color: Green. Label: `S₁ = T(S₀, R₁)` . R1 has a checkmark (✓).
2. **R1 → R2:** Arrow color: Orange. Label: `S₂ = S₁`. R2 has a cross (✗).
3. **R1 → R3:** Arrow color: Orange. Label: `S₃ = T(S₂, R₃)`. R3 has a checkmark (✓).
4. **R2 → R4:** Arrow color: Red. Label: `S₄ = T(S₃, R₄)`. R4 has a checkmark (✓).
5. **R3 → R7:** Arrow color: Orange. Label: `S₇ = S₀`. R7 has a cross (✗).
6. **R4 → R5:** Arrow color: Red. Label: `S₅ = S₄`. R5 has a cross (✗).
7. **R4 → R6:** Arrow color: Red. Label: `S₆ = S₃`. R6 has a cross (✗).
8. **R3 → R8:** Arrow color: Green. Label: `S₈ = T(S₇, R₈)`. R8 has a checkmark (✓).
9. **R8 → R9:** Arrow color: Green. Label: `S₉ = T(S₈, R₉)`. R9 has a checkmark (✓).
10. **R9 → A:** Arrow color: Green. Label: `S₁₀ = T(S₉, A)`. A has a checkmark (✓).
The initial state is Q, labeled as `S₀ = Q`.
### Key Observations
* The diagram shows multiple paths from the initial state Q.
* Some paths lead to successful states (checkmark), while others lead to failed states (cross).
* The transformation function `T` is used in multiple transitions, suggesting a consistent operation applied to different state variables.
* The state variables `S₀` through `S₁₀` are used to track the system's state throughout the transitions.
* The diagram appears to model a process with potential failure points (R2, R5, R6, R7).
### Interpretation
This diagram likely represents a process or algorithm with multiple possible outcomes. The states represent different stages of the process, and the transitions represent the steps taken to move between those stages. The transformation function `T` could represent an operation performed on the state variable, and the checkmarks and crosses indicate whether the operation was successful.
The presence of both successful and failed states suggests that the process is not deterministic and that the outcome depends on the specific conditions encountered during the transitions. The diagram could be used to analyze the process, identify potential bottlenecks, and improve its reliability. The initial state Q represents the starting point, and the final state A represents a successful completion of the process. The diagram provides a visual representation of the possible paths and outcomes, allowing for a clear understanding of the process flow. The use of state variables (S₀ to S₁₀) suggests a system where the current state is explicitly tracked and used in subsequent transitions.